
पक्का करें कि आपके पास MediaPipe Framework का काम करने वाला वर्शन हो. यहां जाएं: इंस्टॉल करने के निर्देश दिए गए हों.
hello worldउदाहरण को चलाने के लिए:$ git clone https://github.com/google/mediapipe.git $ cd mediapipe $ export GLOG_logtostderr=1 # Need bazel flag 'MEDIAPIPE_DISABLE_GPU=1' as desktop GPU is not supported currently. $ bazel run --define MEDIAPIPE_DISABLE_GPU=1 \ mediapipe/examples/desktop/hello_world:hello_world # It should print 10 rows of Hello World! # Hello World! # Hello World! # Hello World! # Hello World! # Hello World! # Hello World! # Hello World! # Hello World! # Hello World! # Hello World!hello worldके उदाहरण में, एक सामान्य MediaPipe ग्राफ़ का इस्तेमाल किया गया हैPrintHelloWorld()फ़ंक्शन, जिसकी जानकारीCalculatorGraphConfigप्रोटो में दी गई है.absl::Status PrintHelloWorld() { // Configures a simple graph, which concatenates 2 PassThroughCalculators. CalculatorGraphConfig config = ParseTextProtoOrDie<CalculatorGraphConfig>(R"( input_stream: "in" output_stream: "out" node { calculator: "PassThroughCalculator" input_stream: "in" output_stream: "out1" } node { calculator: "PassThroughCalculator" input_stream: "out1" output_stream: "out" } )");इस ग्राफ़ को विज़ुअलाइज़ करने के लिए, MediaPipe विज़ुअलाइज़र को चिपकाने के लिए नीचे विज़ुअलाइज़र में CalculatorGraphConfig कॉन्टेंट जोड़ा गया है. यहां जाएं: यहां पढ़ें.
    input_stream: "in"
    output_stream: "out"
    node {
      calculator: "PassThroughCalculator"
      input_stream: "in"
      output_stream: "out1"
    }
    node {
      calculator: "PassThroughCalculator"
      input_stream: "out1"
      output_stream: "out"
    }
इस ग्राफ़ में एक ग्राफ़ इनपुट स्ट्रीम (
in) और एक ग्राफ़ आउटपुट स्ट्रीम शामिल है (out), और दोPassThroughCalculatorक्रम से कनेक्ट किए गए हैं.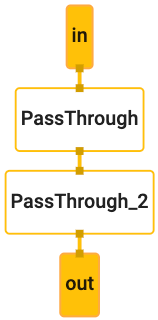
ग्राफ़ चलाने से पहले,
OutputStreamPollerऑब्जेक्ट को आउटपुट स्ट्रीम, ताकि बाद में ग्राफ़ के आउटपुट को वापस लाया जा सके और ग्राफ़ को रन किया जा सके की शुरुआतStartRunसे हुई.CalculatorGraph graph; MP_RETURN_IF_ERROR(graph.Initialize(config)); MP_ASSIGN_OR_RETURN(OutputStreamPoller poller, graph.AddOutputStreamPoller("out")); MP_RETURN_IF_ERROR(graph.StartRun({}));इसके बाद उदाहरण में 10 पैकेट बनाए जाते हैं (हर पैकेट में एक स्ट्रिंग "हैलो" होती है) दुनिया!" जिनमें टाइमस्टैंप की वैल्यू 0, 1, ... 9 के बीच की हों) का इस्तेमाल करके,
MakePacketफ़ंक्शन, हर पैकेट कोinकी मदद से ग्राफ़ में जोड़ता है इनपुट स्ट्रीम को चुनता है और आखिर में ग्राफ़ को पूरा करने के लिए, इनपुट स्ट्रीम को बंद करता है.for (int i = 0; i < 10; ++i) { MP_RETURN_IF_ERROR(graph.AddPacketToInputStream("in", MakePacket<std::string>("Hello World!").At(Timestamp(i)))); } MP_RETURN_IF_ERROR(graph.CloseInputStream("in"));इसके बाद, उदाहरण
OutputStreamPollerऑब्जेक्ट की मदद से, सभी 10 ऑब्जेक्ट को फ़ेच करता है आउटपुट स्ट्रीम के पैकेट, हर पैकेट से स्ट्रिंग कॉन्टेंट हासिल करते हैं और उसे आउटपुट लॉग में प्रिंट करता है.mediapipe::Packet packet; while (poller.Next(&packet)) { LOG(INFO) << packet.Get<string>(); }
सभी को नमस्ते! C++ में
जब तक कुछ अलग से न बताया जाए, तब तक इस पेज की सामग्री को Creative Commons Attribution 4.0 License के तहत और कोड के नमूनों को Apache 2.0 License के तहत लाइसेंस मिला है. ज़्यादा जानकारी के लिए, Google Developers साइट नीतियां देखें. Oracle और/या इससे जुड़ी हुई कंपनियों का, Java एक रजिस्टर किया हुआ ट्रेडमार्क है.
आखिरी बार 2025-07-24 (UTC) को अपडेट किया गया.