
MediaPipe Framework の動作バージョンがあることを確認します。詳しくは、 インストール手順をご覧ください。
hello worldのサンプルを実行するには:$ git clone https://github.com/google/mediapipe.git $ cd mediapipe $ export GLOG_logtostderr=1 # Need bazel flag 'MEDIAPIPE_DISABLE_GPU=1' as desktop GPU is not supported currently. $ bazel run --define MEDIAPIPE_DISABLE_GPU=1 \ mediapipe/examples/desktop/hello_world:hello_world # It should print 10 rows of Hello World! # Hello World! # Hello World! # Hello World! # Hello World! # Hello World! # Hello World! # Hello World! # Hello World! # Hello World! # Hello World!hello worldの例では、シンプルな MediaPipe グラフを使用しています。CalculatorGraphConfigproto で定義されるPrintHelloWorld()関数。absl::Status PrintHelloWorld() { // Configures a simple graph, which concatenates 2 PassThroughCalculators. CalculatorGraphConfig config = ParseTextProtoOrDie<CalculatorGraphConfig>(R"( input_stream: "in" output_stream: "out" node { calculator: "PassThroughCalculator" input_stream: "in" output_stream: "out1" } node { calculator: "PassThroughCalculator" input_stream: "out1" output_stream: "out" } )");このグラフを可視化するには、 MediaPipe Visualizer です。 以下の CalculatorGraphConfig コンテンツをビジュアライザに読み込みます。詳しくは、 ビジュアライザのヘルプについては、こちらをご覧ください。
    input_stream: "in"
    output_stream: "out"
    node {
      calculator: "PassThroughCalculator"
      input_stream: "in"
      output_stream: "out1"
    }
    node {
      calculator: "PassThroughCalculator"
      input_stream: "out1"
      output_stream: "out"
    }
このグラフは 1 つのグラフ入力ストリーム(
in)と 1 つのグラフ出力ストリームで構成されています (out)、2 つのPassThroughCalculatorを直列接続しました。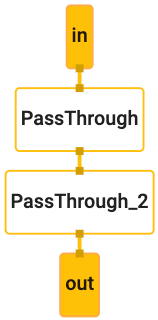
グラフを実行する前に、
OutputStreamPollerオブジェクトが 後でグラフ出力を取得し、グラフの実行をStartRunで始まる。CalculatorGraph graph; MP_RETURN_IF_ERROR(graph.Initialize(config)); MP_ASSIGN_OR_RETURN(OutputStreamPoller poller, graph.AddOutputStreamPoller("out")); MP_RETURN_IF_ERROR(graph.StartRun({}));この例では、10 個のパケットが作成され、各パケットに文字列「Hello」が含まれる 世界一!」0、1、... 9 の範囲のタイムスタンプ値を持つ)で、
MakePacket関数。inを使用して各パケットをグラフに追加します。 最後に入力ストリームを閉じてグラフの実行を終了します。for (int i = 0; i < 10; ++i) { MP_RETURN_IF_ERROR(graph.AddPacketToInputStream("in", MakePacket<std::string>("Hello World!").At(Timestamp(i)))); } MP_RETURN_IF_ERROR(graph.CloseInputStream("in"));この例では、
OutputStreamPollerオブジェクトを使用して、10 個すべてを取得します。 取得し、各パケットから文字列の内容を取得します。 出力ログに出力します。mediapipe::Packet packet; while (poller.Next(&packet)) { LOG(INFO) << packet.Get<string>(); }
C++ で Hello World!
特に記載のない限り、このページのコンテンツはクリエイティブ・コモンズの表示 4.0 ライセンスにより使用許諾されます。コードサンプルは Apache 2.0 ライセンスにより使用許諾されます。詳しくは、Google Developers サイトのポリシーをご覧ください。Java は Oracle および関連会社の登録商標です。
最終更新日 2025-07-24 UTC。