
Prüfen Sie, ob Sie eine funktionierende Version von MediaPipe Framework haben. Weitere Informationen finden Sie unter Installationsanleitung.
So führen Sie das
hello world-Beispiel aus:$ git clone https://github.com/google/mediapipe.git $ cd mediapipe $ export GLOG_logtostderr=1 # Need bazel flag 'MEDIAPIPE_DISABLE_GPU=1' as desktop GPU is not supported currently. $ bazel run --define MEDIAPIPE_DISABLE_GPU=1 \ mediapipe/examples/desktop/hello_world:hello_world # It should print 10 rows of Hello World! # Hello World! # Hello World! # Hello World! # Hello World! # Hello World! # Hello World! # Hello World! # Hello World! # Hello World! # Hello World!Im Beispiel
hello worldwird eine einfache MediaPipe-Grafik in derPrintHelloWorld()-Funktion, definiert in einemCalculatorGraphConfig-Proto.absl::Status PrintHelloWorld() { // Configures a simple graph, which concatenates 2 PassThroughCalculators. CalculatorGraphConfig config = ParseTextProtoOrDie<CalculatorGraphConfig>(R"( input_stream: "in" output_stream: "out" node { calculator: "PassThroughCalculator" input_stream: "in" output_stream: "out1" } node { calculator: "PassThroughCalculator" input_stream: "out1" output_stream: "out" } )");Sie können dieses Diagramm MediaPipe Visualizer durch Einfügen des RechnerGraphConfig-Inhalt in den Visualizer eingeben. Weitere Informationen finden Sie unter finden Sie hier.
    input_stream: "in"
    output_stream: "out"
    node {
      calculator: "PassThroughCalculator"
      input_stream: "in"
      output_stream: "out1"
    }
    node {
      calculator: "PassThroughCalculator"
      input_stream: "out1"
      output_stream: "out"
    }
Dieses Diagramm besteht aus 1 Grafikeingabestream (
in) und 1 Grafikausgabestream (out) und zweiPassThroughCalculators sind seriell verbunden.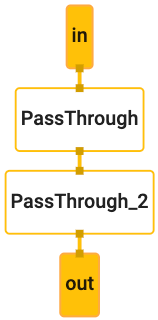
Vor dem Ausführen der Grafik wird ein
OutputStreamPoller-Objekt mit dem um die Ausgabe des Diagramms später abzurufen, und die Ausführung des Graphen. wird mitStartRungestartet.CalculatorGraph graph; MP_RETURN_IF_ERROR(graph.Initialize(config)); MP_ASSIGN_OR_RETURN(OutputStreamPoller poller, graph.AddOutputStreamPoller("out")); MP_RETURN_IF_ERROR(graph.StartRun({}));Im Beispiel werden dann 10 Pakete erstellt (jedes Paket enthält den String „Hello Welt!“ mit Zeitstempelwerten im Bereich von 0, 1, ... 9) mithilfe der Methode
MakePacket, fügt jedes Paket über dieinin das Diagramm ein Eingabestreams und schließt den Eingabestream, um die Graphausführung abzuschließen.for (int i = 0; i < 10; ++i) { MP_RETURN_IF_ERROR(graph.AddPacketToInputStream("in", MakePacket<std::string>("Hello World!").At(Timestamp(i)))); } MP_RETURN_IF_ERROR(graph.CloseInputStream("in"));Über das
OutputStreamPoller-Objekt werden dann alle zehn aus dem Ausgabestream, ruft den String-Inhalt aus jedem Paket ab. und gibt sie im Ausgabelog aus.mediapipe::Packet packet; while (poller.Next(&packet)) { LOG(INFO) << packet.Get<string>(); }
Hallo Welt! in C++
Sofern nicht anders angegeben, sind die Inhalte dieser Seite unter der Creative Commons Attribution 4.0 License und Codebeispiele unter der Apache 2.0 License lizenziert. Weitere Informationen finden Sie in den Websiterichtlinien von Google Developers. Java ist eine eingetragene Marke von Oracle und/oder seinen Partnern.
Zuletzt aktualisiert: 2025-07-24 (UTC).