
ตรวจสอบว่าคุณมีเฟรมเวิร์ก MediaPipe เวอร์ชันที่ใช้งานได้ โปรดดู วิธีการติดตั้ง
วิธีเรียกใช้ตัวอย่าง
hello world$ git clone https://github.com/google/mediapipe.git $ cd mediapipe $ export GLOG_logtostderr=1 # Need bazel flag 'MEDIAPIPE_DISABLE_GPU=1' as desktop GPU is not supported currently. $ bazel run --define MEDIAPIPE_DISABLE_GPU=1 \ mediapipe/examples/desktop/hello_world:hello_world # It should print 10 rows of Hello World! # Hello World! # Hello World! # Hello World! # Hello World! # Hello World! # Hello World! # Hello World! # Hello World! # Hello World! # Hello World!ตัวอย่าง
hello worldใช้กราฟ MediaPipe อย่างง่ายในองค์ประกอบ ฟังก์ชันPrintHelloWorld()ที่กำหนดไว้ในโปรโตคอลCalculatorGraphConfigabsl::Status PrintHelloWorld() { // Configures a simple graph, which concatenates 2 PassThroughCalculators. CalculatorGraphConfig config = ParseTextProtoOrDie<CalculatorGraphConfig>(R"( input_stream: "in" output_stream: "out" node { calculator: "PassThroughCalculator" input_stream: "in" output_stream: "out1" } node { calculator: "PassThroughCalculator" input_stream: "out1" output_stream: "out" } )");คุณสามารถดูภาพกราฟนี้ได้โดยใช้ MediaPipe Visualizer โดยการวาง เนื้อหา CalculatorGraphConfig ด้านล่างลงใน Visualizer โปรดดู ที่นี่สำหรับความช่วยเหลือเกี่ยวกับโปรแกรมสร้างภาพ
    input_stream: "in"
    output_stream: "out"
    node {
      calculator: "PassThroughCalculator"
      input_stream: "in"
      output_stream: "out1"
    }
    node {
      calculator: "PassThroughCalculator"
      input_stream: "out1"
      output_stream: "out"
    }
กราฟนี้ประกอบด้วยสตรีมอินพุตกราฟ 1 รายการ (
in) และสตรีมเอาต์พุตกราฟ 1 รายการ (out) และPassThroughCalculator2 เครื่องเชื่อมต่อแบบต่อเนื่อง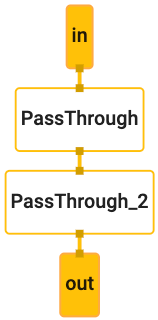
ก่อนที่จะเรียกใช้กราฟ ออบเจ็กต์
OutputStreamPollerจะเชื่อมต่อกับ สตรีมเอาต์พุตเพื่อเรียกเอาต์พุตกราฟในภายหลังและการเรียกใช้กราฟ เริ่มต้นด้วยStartRunCalculatorGraph graph; MP_RETURN_IF_ERROR(graph.Initialize(config)); MP_ASSIGN_OR_RETURN(OutputStreamPoller poller, graph.AddOutputStreamPoller("out")); MP_RETURN_IF_ERROR(graph.StartRun({}));จากนั้นตัวอย่างจะสร้างแพ็กเก็ต 10 แพ็กเก็ต (แต่ละแพ็กเก็ตจะมีสตริง " Hello ทั่วโลก!" ที่มีค่าการประทับเวลาตั้งแต่ 0, 1, ... 9) โดยใช้แอตทริบิวต์
MakePacketเพิ่มแต่ละแพ็กเก็ตลงในกราฟผ่านinสตรีมอินพุต และสุดท้ายคือปิดสตรีมอินพุตเพื่อให้กราฟทำงานจนเสร็จสิ้นfor (int i = 0; i < 10; ++i) { MP_RETURN_IF_ERROR(graph.AddPacketToInputStream("in", MakePacket<std::string>("Hello World!").At(Timestamp(i)))); } MP_RETURN_IF_ERROR(graph.CloseInputStream("in"));จากออบเจ็กต์
OutputStreamPollerตัวอย่างจะดึงข้อมูลทั้ง 10 รายการ แพ็กเก็ตจากสตรีมเอาต์พุตจะนำเนื้อหาสตริงออกจากแต่ละแพ็กเก็ต และพิมพ์ไปยังบันทึกเอาต์พุตmediapipe::Packet packet; while (poller.Next(&packet)) { LOG(INFO) << packet.Get<string>(); }
สวัสดีทุกคน! ใน C++
เนื้อหาของหน้าเว็บนี้ได้รับอนุญาตภายใต้ใบอนุญาตที่ต้องระบุที่มาของครีเอทีฟคอมมอนส์ 4.0 และตัวอย่างโค้ดได้รับอนุญาตภายใต้ใบอนุญาต Apache 2.0 เว้นแต่จะระบุไว้เป็นอย่างอื่น โปรดดูรายละเอียดที่นโยบายเว็บไซต์ Google Developers Java เป็นเครื่องหมายการค้าจดทะเบียนของ Oracle และ/หรือบริษัทในเครือ
อัปเดตล่าสุด 2025-07-24 UTC