המגבלות של מכשירי הקצה מחייבות לעיתים קרובות לבצע שלבים נוספים כדי להמיר ולבצע אופטימיזציה של מודלים לפני שהם פועלים ביעילות, והתצוגה החזותית היא אחת מהדרכים היעילות ביותר להבין מודל ולזהות יעדים לאופטימיזציה.
המרה
קידוד ברמת הבייט
אופטימיזציה
התכונה 'השוואה זה לצד זה' ב-Model Explorer מאפשרת לזהות בקלות בעיות שקשורות להמרות. אפשר לנווט בתרשים שכבה אחר שכבה, ולהרחיב ולכווץ קטעים כדי להציג פירוט נוסף.
בודקים את המבנה הפנימי ואת החיבורים בתוך הגרפים ברמת הפירוט הנדרשת.
שימוש ב-Model Explorer כדי לזהות פעולות בעייתיות שמושפעות מהקידוד. אפשר למיין את הפעולות לפי מדדי שגיאות כדי לזהות ירידות באיכות, לקבל תובנות לגבי כל שכבה ולהשוות בין תוצאות קידוד שונות כדי למצוא את האיזון האידיאלי בין גודל המודל לאיכות שלו.
בעזרת Model Explorer תוכלו להבין טוב יותר את הפלט של כלי הבדיקות והניפוי הבאגים. לקבל תובנות לגבי הפעולות שאפשר להריץ ב-GPU, למיין פעולות לפי זמן אחזור ולהשוות את הביצועים של כל פעולה בין המאיצים השונים.
תמיכה במודלים גדולים
Model Explorer תוכנן להפיק מודלים גדולים בצורה חלקה. אלפי צמתים? אין בעיה. מנוע הרינדור שמבוסס על GPU מסוגל להתאים את עצמו כדי ליצור רינדור חלק גם של מודלים גדולים מאוד. בנוסף, הגישה הייחודית של Model Explorer לכווץ שכבות כמו מערכת של קבצים ותיקיות מאפשרת לנווט מהר יותר ובקלות רבה יותר.
תכונות שיעזרו לכם לעבוד מהר יותר
חיפוש
תצוגה מפוצלת
שכבות-על של נתונים
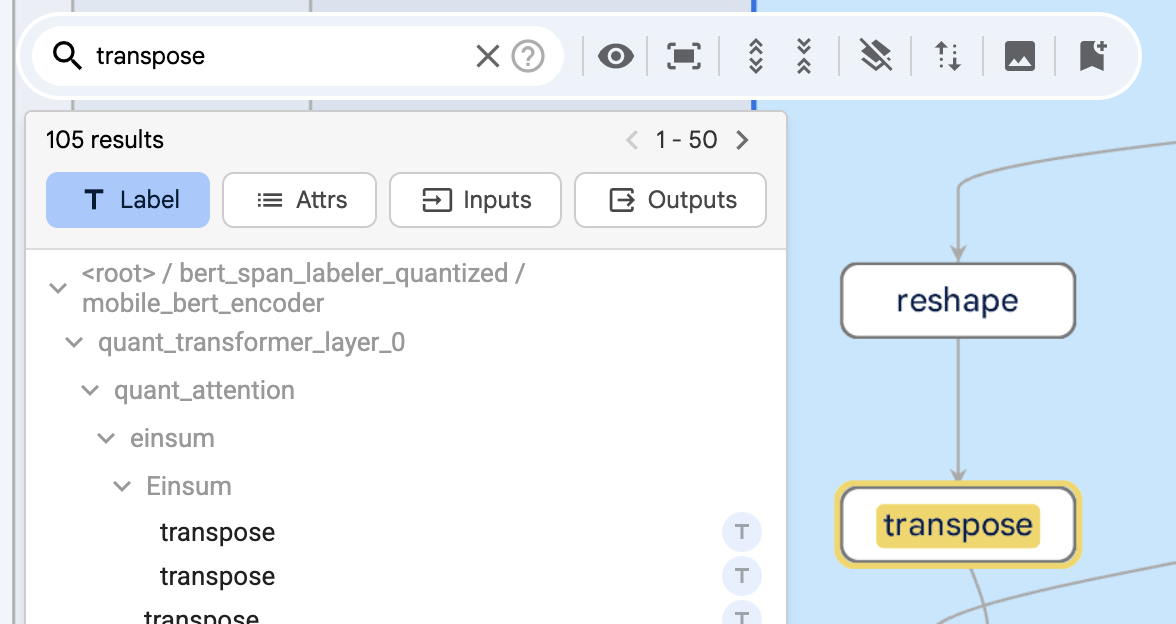
חיפוש יעיל שמבוסס על ביטוי רגולרי עוזר לאתר צמתים ספציפיים, לסנן אותם ולהדגיש אותם.
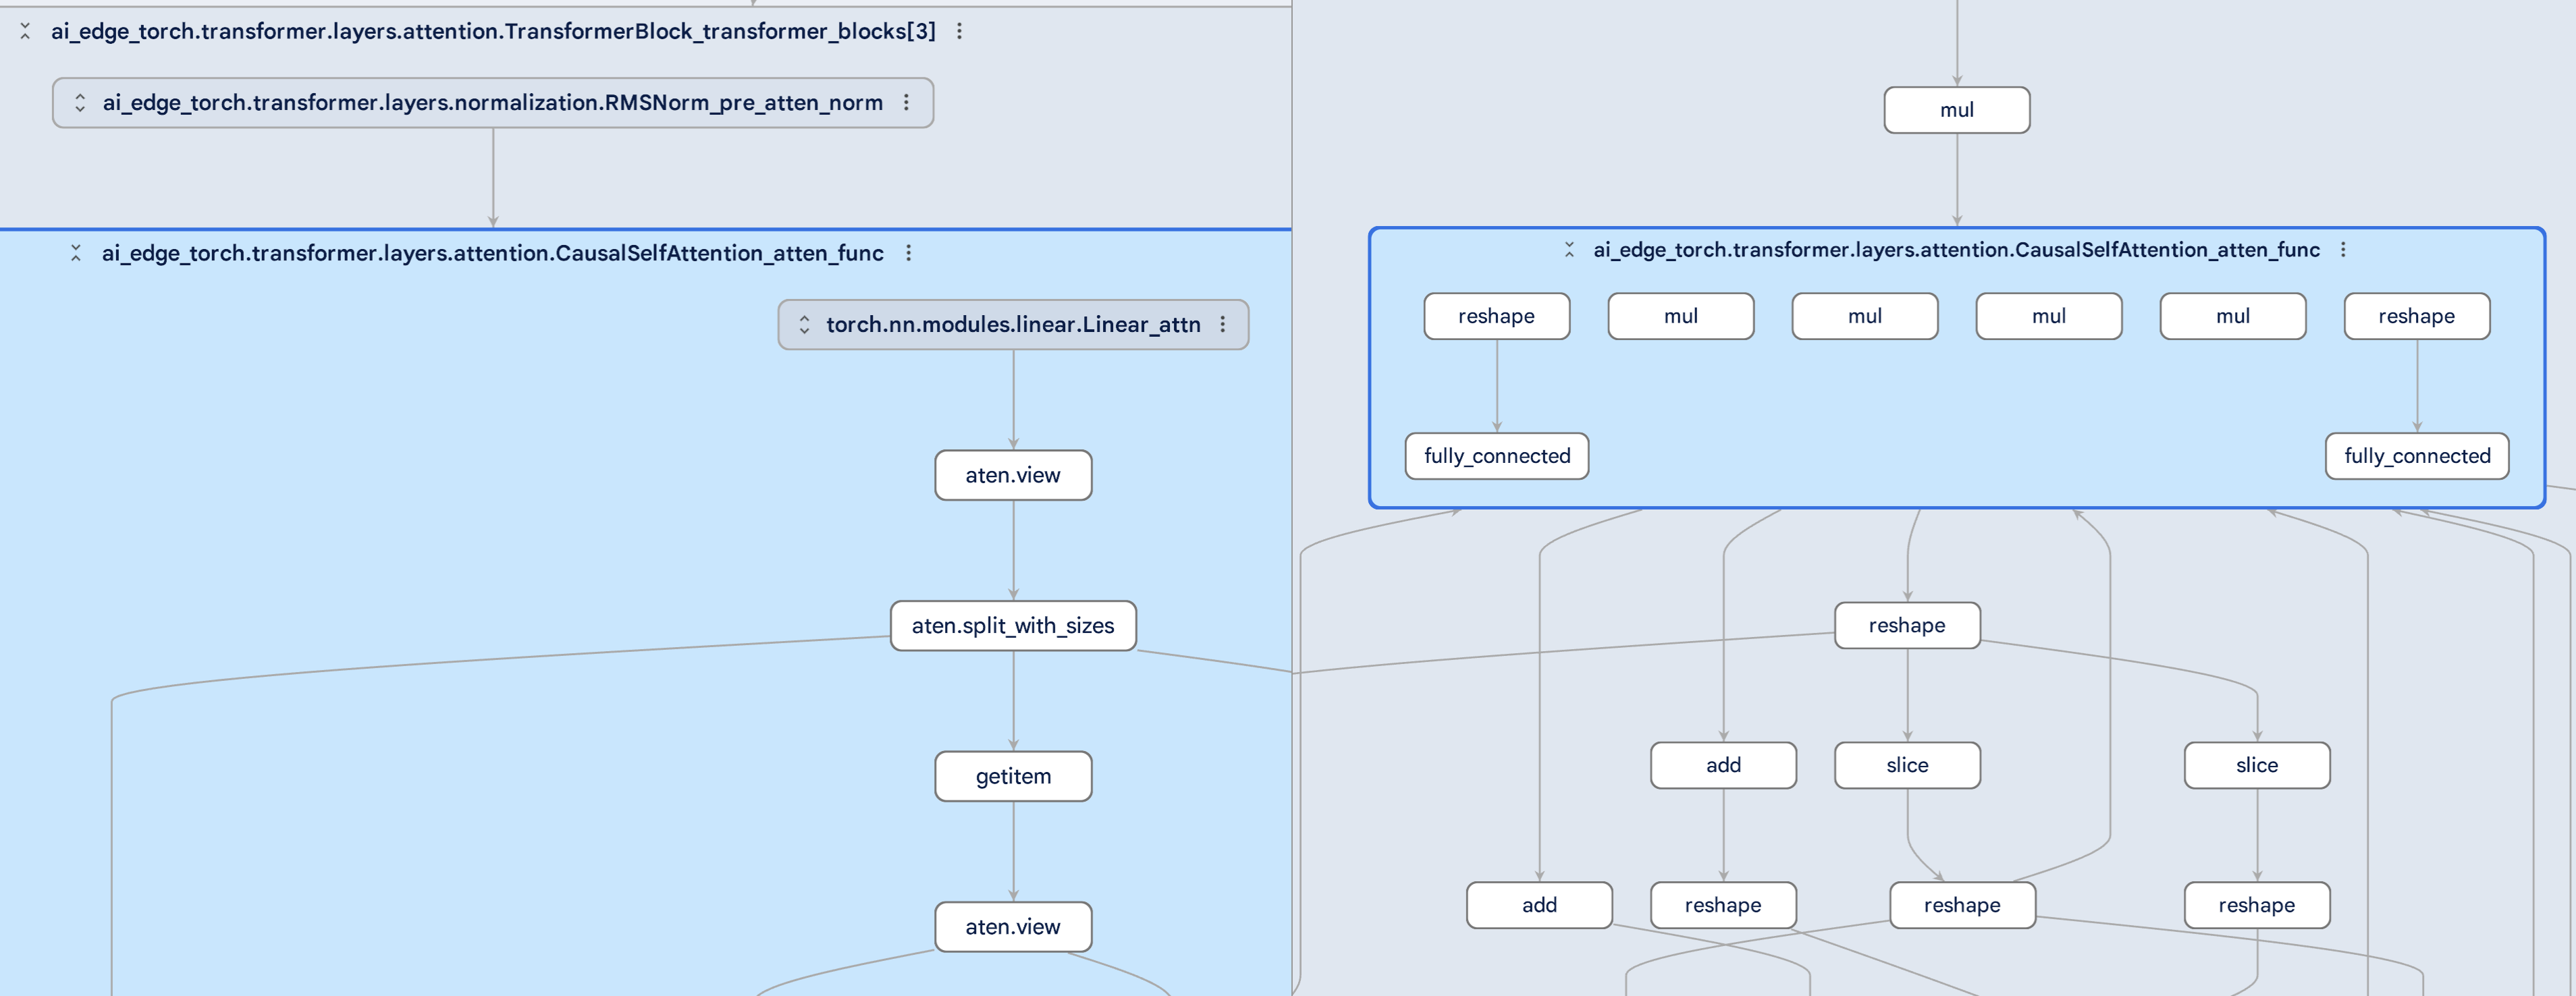
אפשר לטעון מודלים זה לצד זה באותה כרטיסייה כדי להשוות ביניהם בקלות.
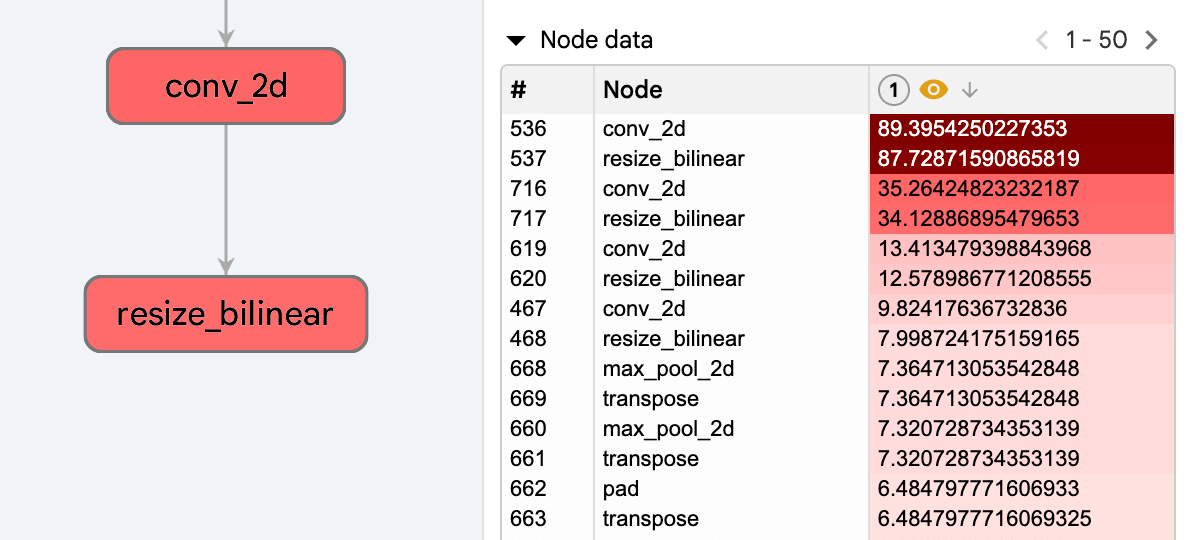
אפשר לטעון נתונים מותאמים אישית ספציפיים לצמתים אל סייר המודלים כדי לזהות במהירות נקודות חמות ובעיות אחרות במודל.
ייצוא לקובץ PNG
הוספת סימניות
גישה קלה למטא-נתונים
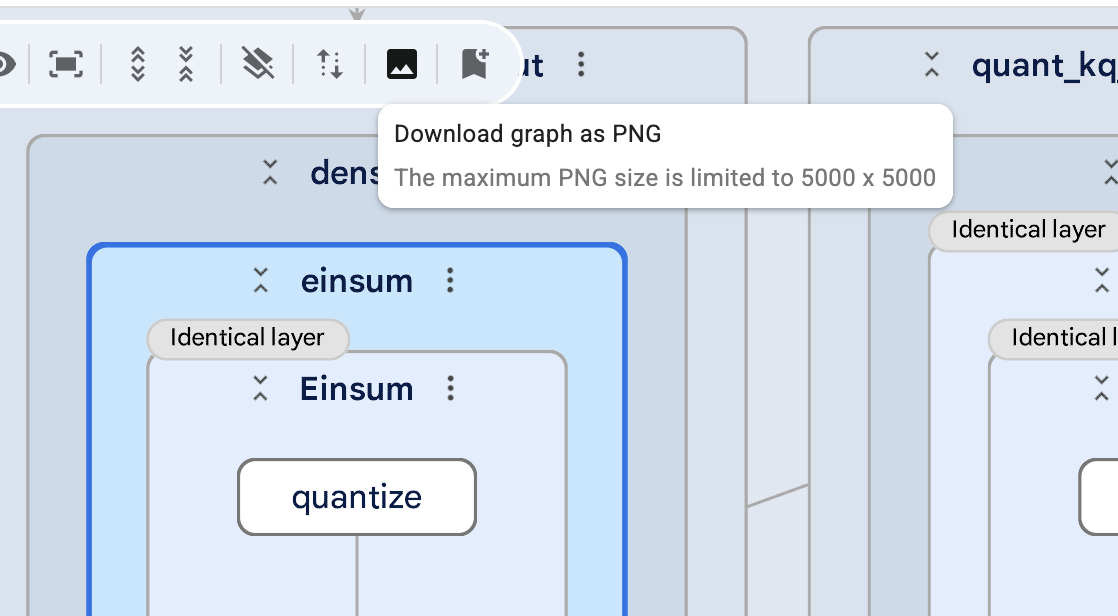
אפשר לייצא תמונה של התרשים בלחיצה על לחצן כדי לשתף אותה עם הצוות.
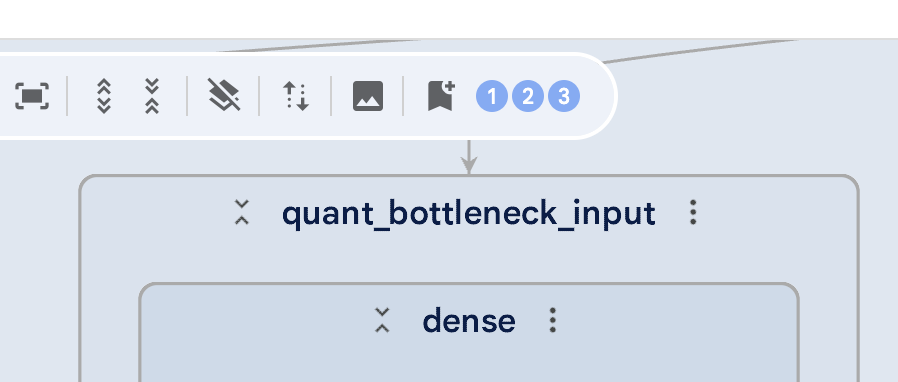
כדי לשמור את המיקום שלכם בתרשים, מוסיפים סימניות. כך תוכלו לעבור בקלות בין אזורים.
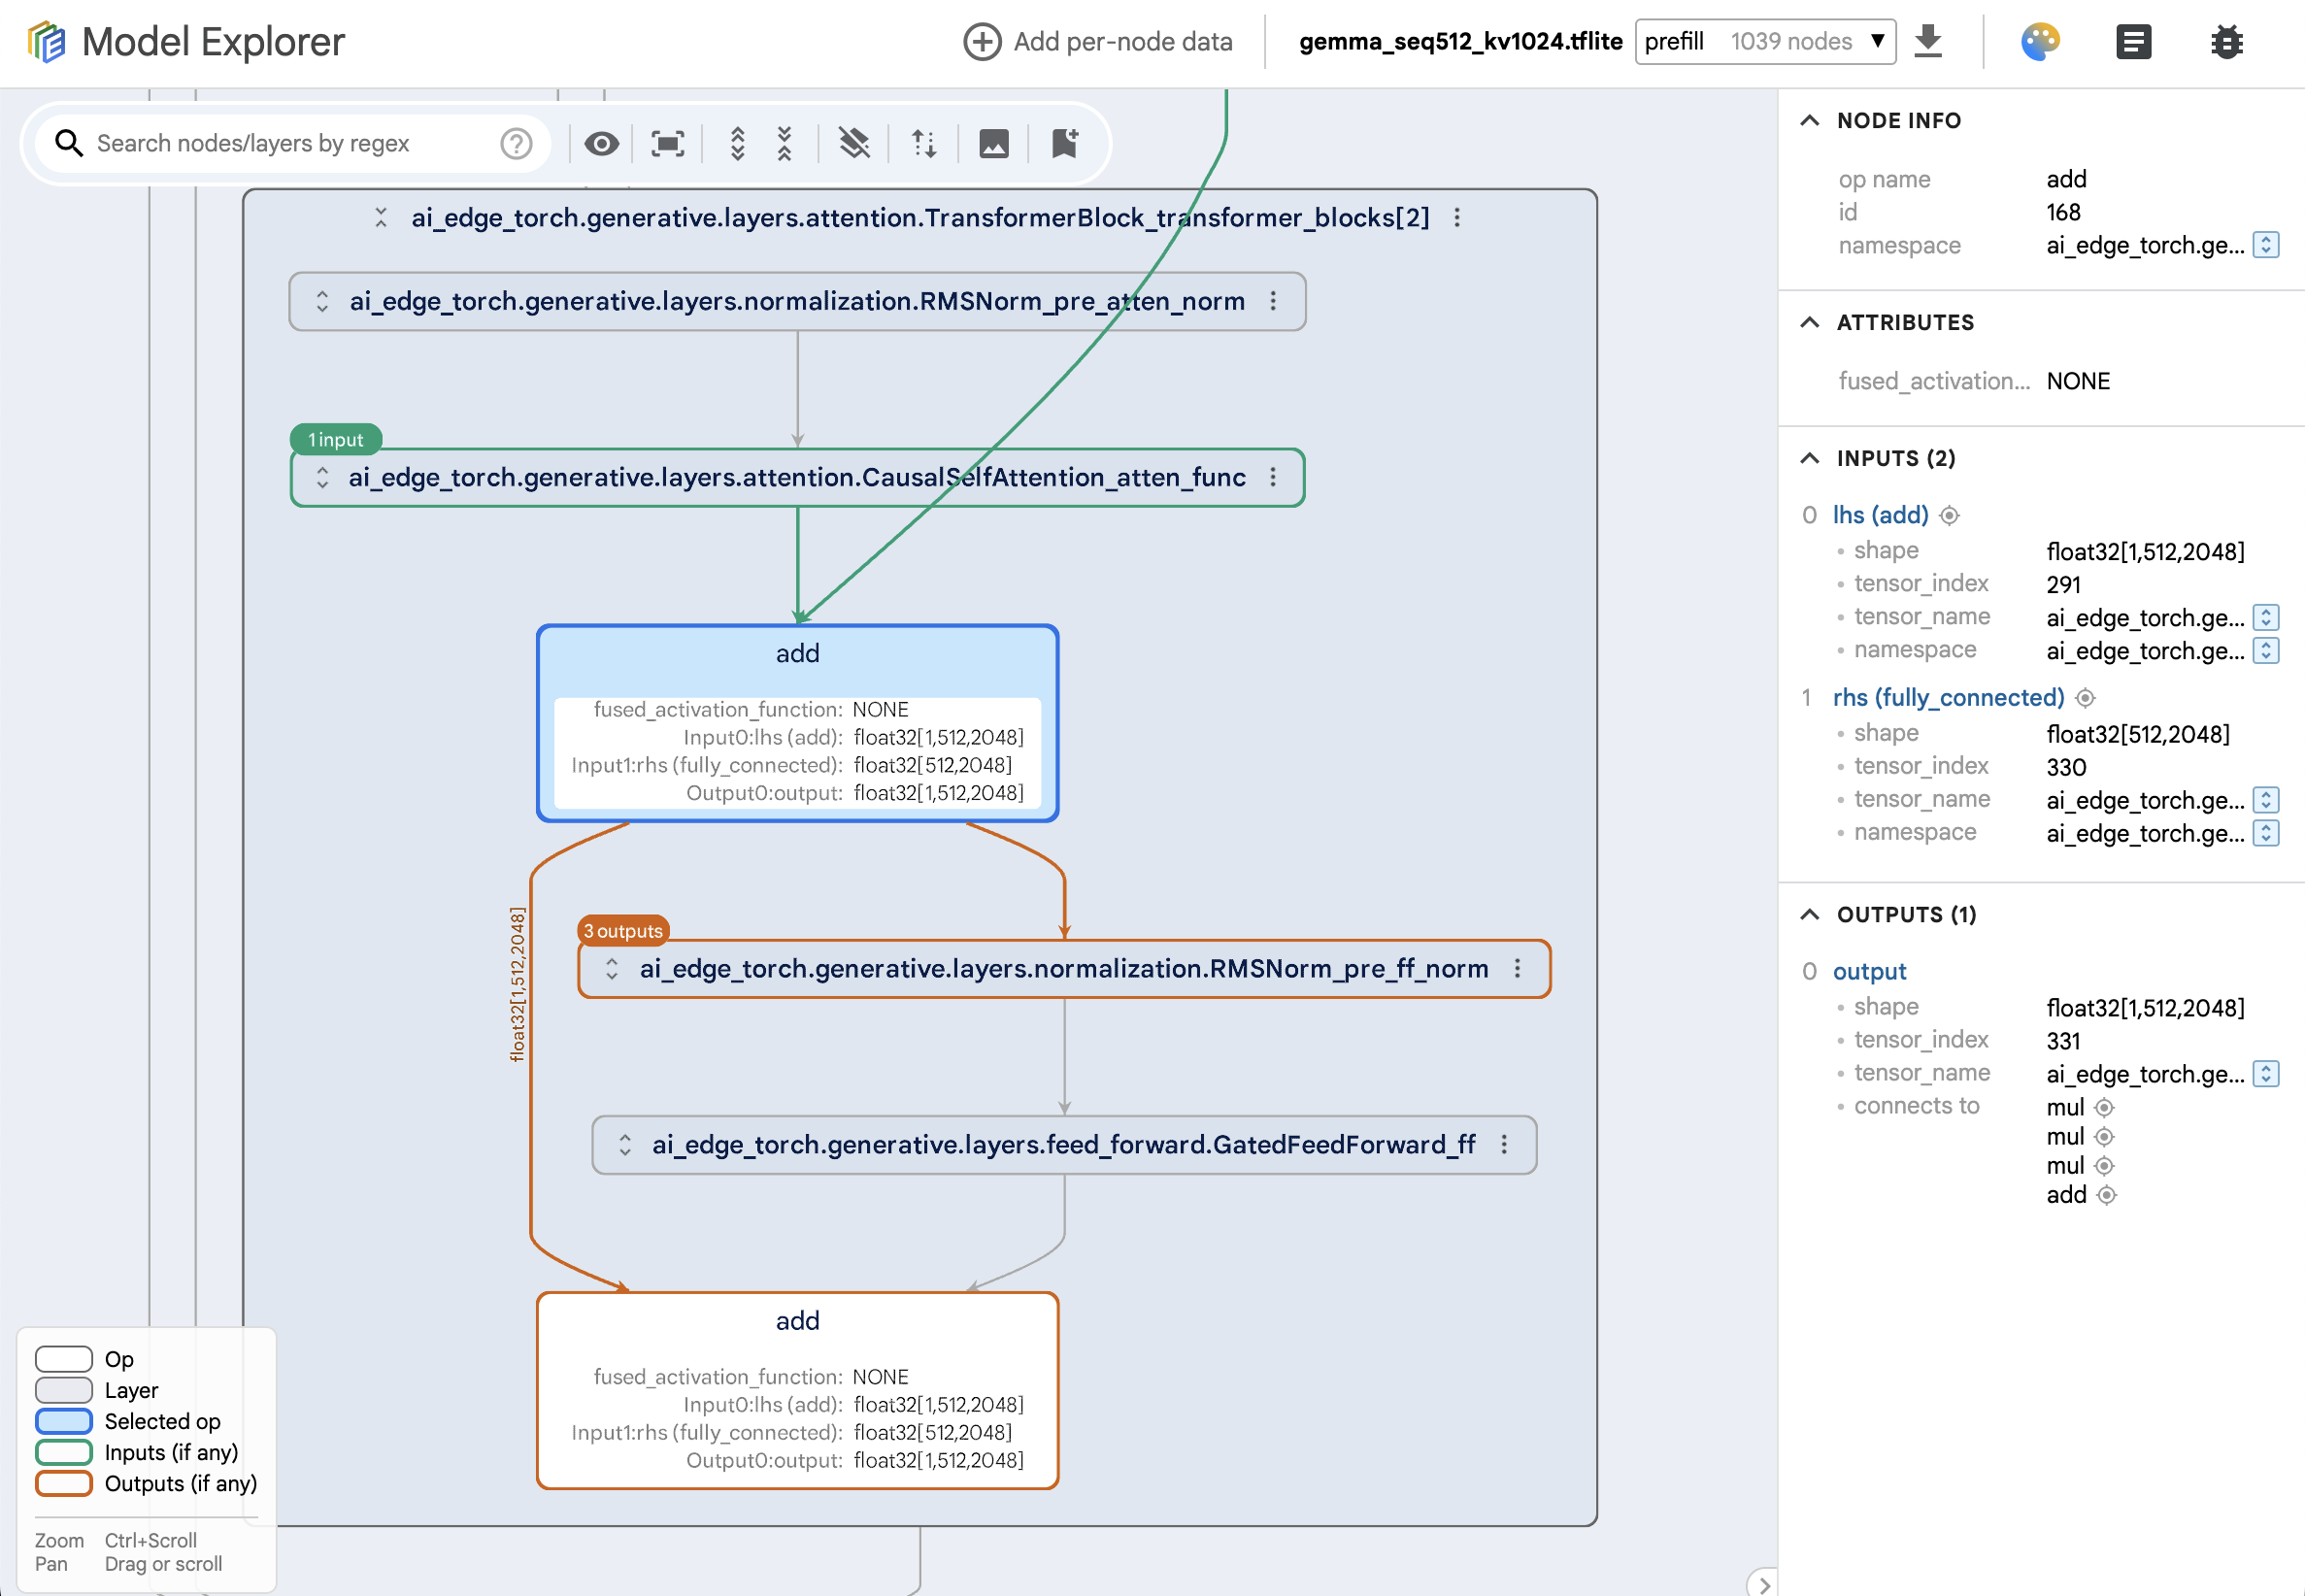
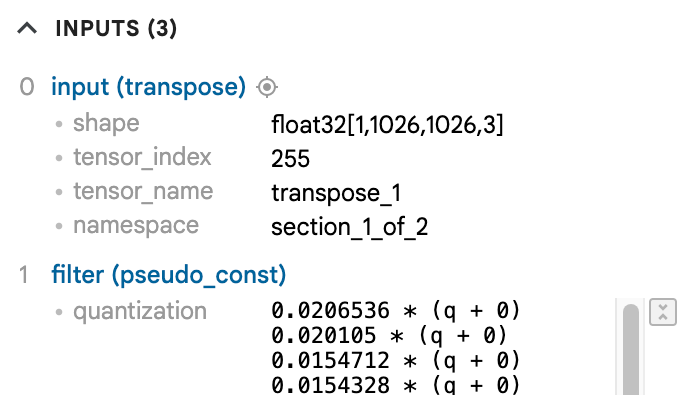
הצגת צורות של טינסורים, מעקב אחר קלט ופלט, הדגשת שכבות זהות, הצגת מספרי צמתים צאצאים ועוד.
שתי דרכים לשימוש בכלי 'ניתוח מודלים'
הפעלה מקומית
הרצה ב-notebook של Colab
פועלים לפי הוראות ההתקנה הקלות ב-GitHub כדי להגדיר את Model Explorer במחשב המקומי. הוא פועל בחלון דפדפן וכל הנתונים נשארים מקומיים.
תמיכה ב-Linux, ב-Mac וב-Windows.
Model Explorer פועל היטב ב-Colab, כך שתוכלו לשלב אותו בתהליך העבודה הקיים שלכם לפיתוח מודלים. אתם יכולים לנסות את הדף המודגים או לפעול לפי הוראות ההתקנה כדי להוסיף אותו למסמך משלכם.
[[["התוכן קל להבנה","easyToUnderstand","thumb-up"],["התוכן עזר לי לפתור בעיה","solvedMyProblem","thumb-up"],["סיבה אחרת","otherUp","thumb-up"]],[["חסרים לי מידע או פרטים","missingTheInformationINeed","thumb-down"],["התוכן מורכב מדי או עם יותר מדי שלבים","tooComplicatedTooManySteps","thumb-down"],["התוכן לא עדכני","outOfDate","thumb-down"],["בעיה בתרגום","translationIssue","thumb-down"],["בעיה בדוגמאות/בקוד","samplesCodeIssue","thumb-down"],["סיבה אחרת","otherDown","thumb-down"]],["עדכון אחרון: 2025-01-13 (שעון UTC)."],[],[],null,["# Model Explorer\n\n**A visualization tool that lets you analyze ML models and graphs, accelerating\ndeployment to on-device targets.**\n\n[Get Started](https://github.com/google-ai-edge/model-explorer/wiki/1.-Installation)\n[Try it in Colab](https://github.com/google-ai-edge/model-explorer/blob/main/example_colabs/quick_start.ipynb)\n[Learn More](https://github.com/google-ai-edge/model-explorer/)\n\n### Making edge development faster\n\nThe constraints of edge devices often necessitate extra steps to convert and\noptimize models before they run efficiently, and visualization is one of the\nmost effective ways to understand a model and identify targets for optimization.\n\n| **Conversion** | **Quantization** | **Optimization** |\n|-----------------------------------------------------------------------------------------------------------------------------------------------------------------------------------------------------------------------------------------------------------------------------------------------------|-----------------------------------------------------------------------------------------------------------------------------------------------------------------------------------------------------------------------------------------------------|----------------------------------------------------------------------------------------------------------------------------------------------------------------------------------------------------------------------|\n| Model Explorer's side-by-side comparison feature makes it easier to spot conversion-related issues. Navigate the graph layer by layer, diving deeper into the graph by expanding and collapsing sections. Inspect the internal structure and connections within graphs at the granularity you need. | Use Model Explorer to identify problematic operations affected by quantization. Sort ops by error metrics to find quality drops, get insights per layer, and compare different quantization results to find the ideal model size-quality trade-off. | Use Model Explorer to better understand the output from your benchmarking and debugging tools. Gain insights into which ops can run on GPU, sort ops by latency, and compare per-op performance across accelerators. |\n\n### Support for large models\n\nModel Explorer is designed to render large models seamlessly. Thousands of\nnodes? No problem. The GPU-based rendering engine is capable of scaling up to\nsmoothly render even very large models. And Model Explorer's unique approach to\ncollapsing layers like a system of files and folders means that it's faster and\neasier to navigate.\n\n### Features designed to help you work faster\n\n| **Search** | **Split View** | **Data Overlays** |\n|-------------------------------------------------------------------------------------|--------------------------------------------------------------------------------------------|---------------------------------------------------------------------------------------------------------------------|\n| Powerful regex-based search helps you locate, filter, and highlight specific nodes. | Load models side by side in the same tab for easy comparison. | Load custom, node-specific data into Model Explorer to quickly identify hot spots and other issues with your model. |\n| With the click of a button, export an image of the graph to share with your team. | Save your location in the graph by adding bookmarks, making it easy to jump between areas. | View tensor shapes, trace inputs and outputs, highlight identical layers, see child node counts, and more. |\n\n### Two ways to use Model Explorer\n\n| **Run it locally** | **Run it in a Colab notebook** |\n|--------------------------------------------------------------------------------------------------------------------------------------------------------------------------------------------------------------------------------------------------------------------------|--------------------------------------------------------------------------------------------------------------------------------------------------------------------------------------------------------------------------------------------------------------------------------------------------------------------------------------------------------------------------------------|\n| Follow the easy [installation instructions](https://github.com/google-ai-edge/model-explorer/wiki/1.-Installation) on GitHub to set up Model Explorer on your local machine. It runs in a browser window and all your data stays local. Supports Linux, Mac and Windows. | Model Explorer runs well in Colab, meaning you can integrate it into your existing model development workflow. Try the [demo notebook](https://github.com/google-ai-edge/model-explorer/blob/main/example_colabs/quick_start.ipynb) or follow the [installation instructions](https://github.com/google-ai-edge/model-explorer/wiki/5.-Run-in-Colab-Notebook) to add it to your own. |"]]