
A visualization tool that lets you analyze ML models and graphs, accelerating deployment to on-device targets.
Get Started Try it in Colab Learn More
Making edge development faster
The constraints of edge devices often necessitate extra steps to convert and optimize models before they run efficiently, and visualization is one of the most effective ways to understand a model and identify targets for optimization.
| Conversion | Quantization | Optimization |
|---|---|---|
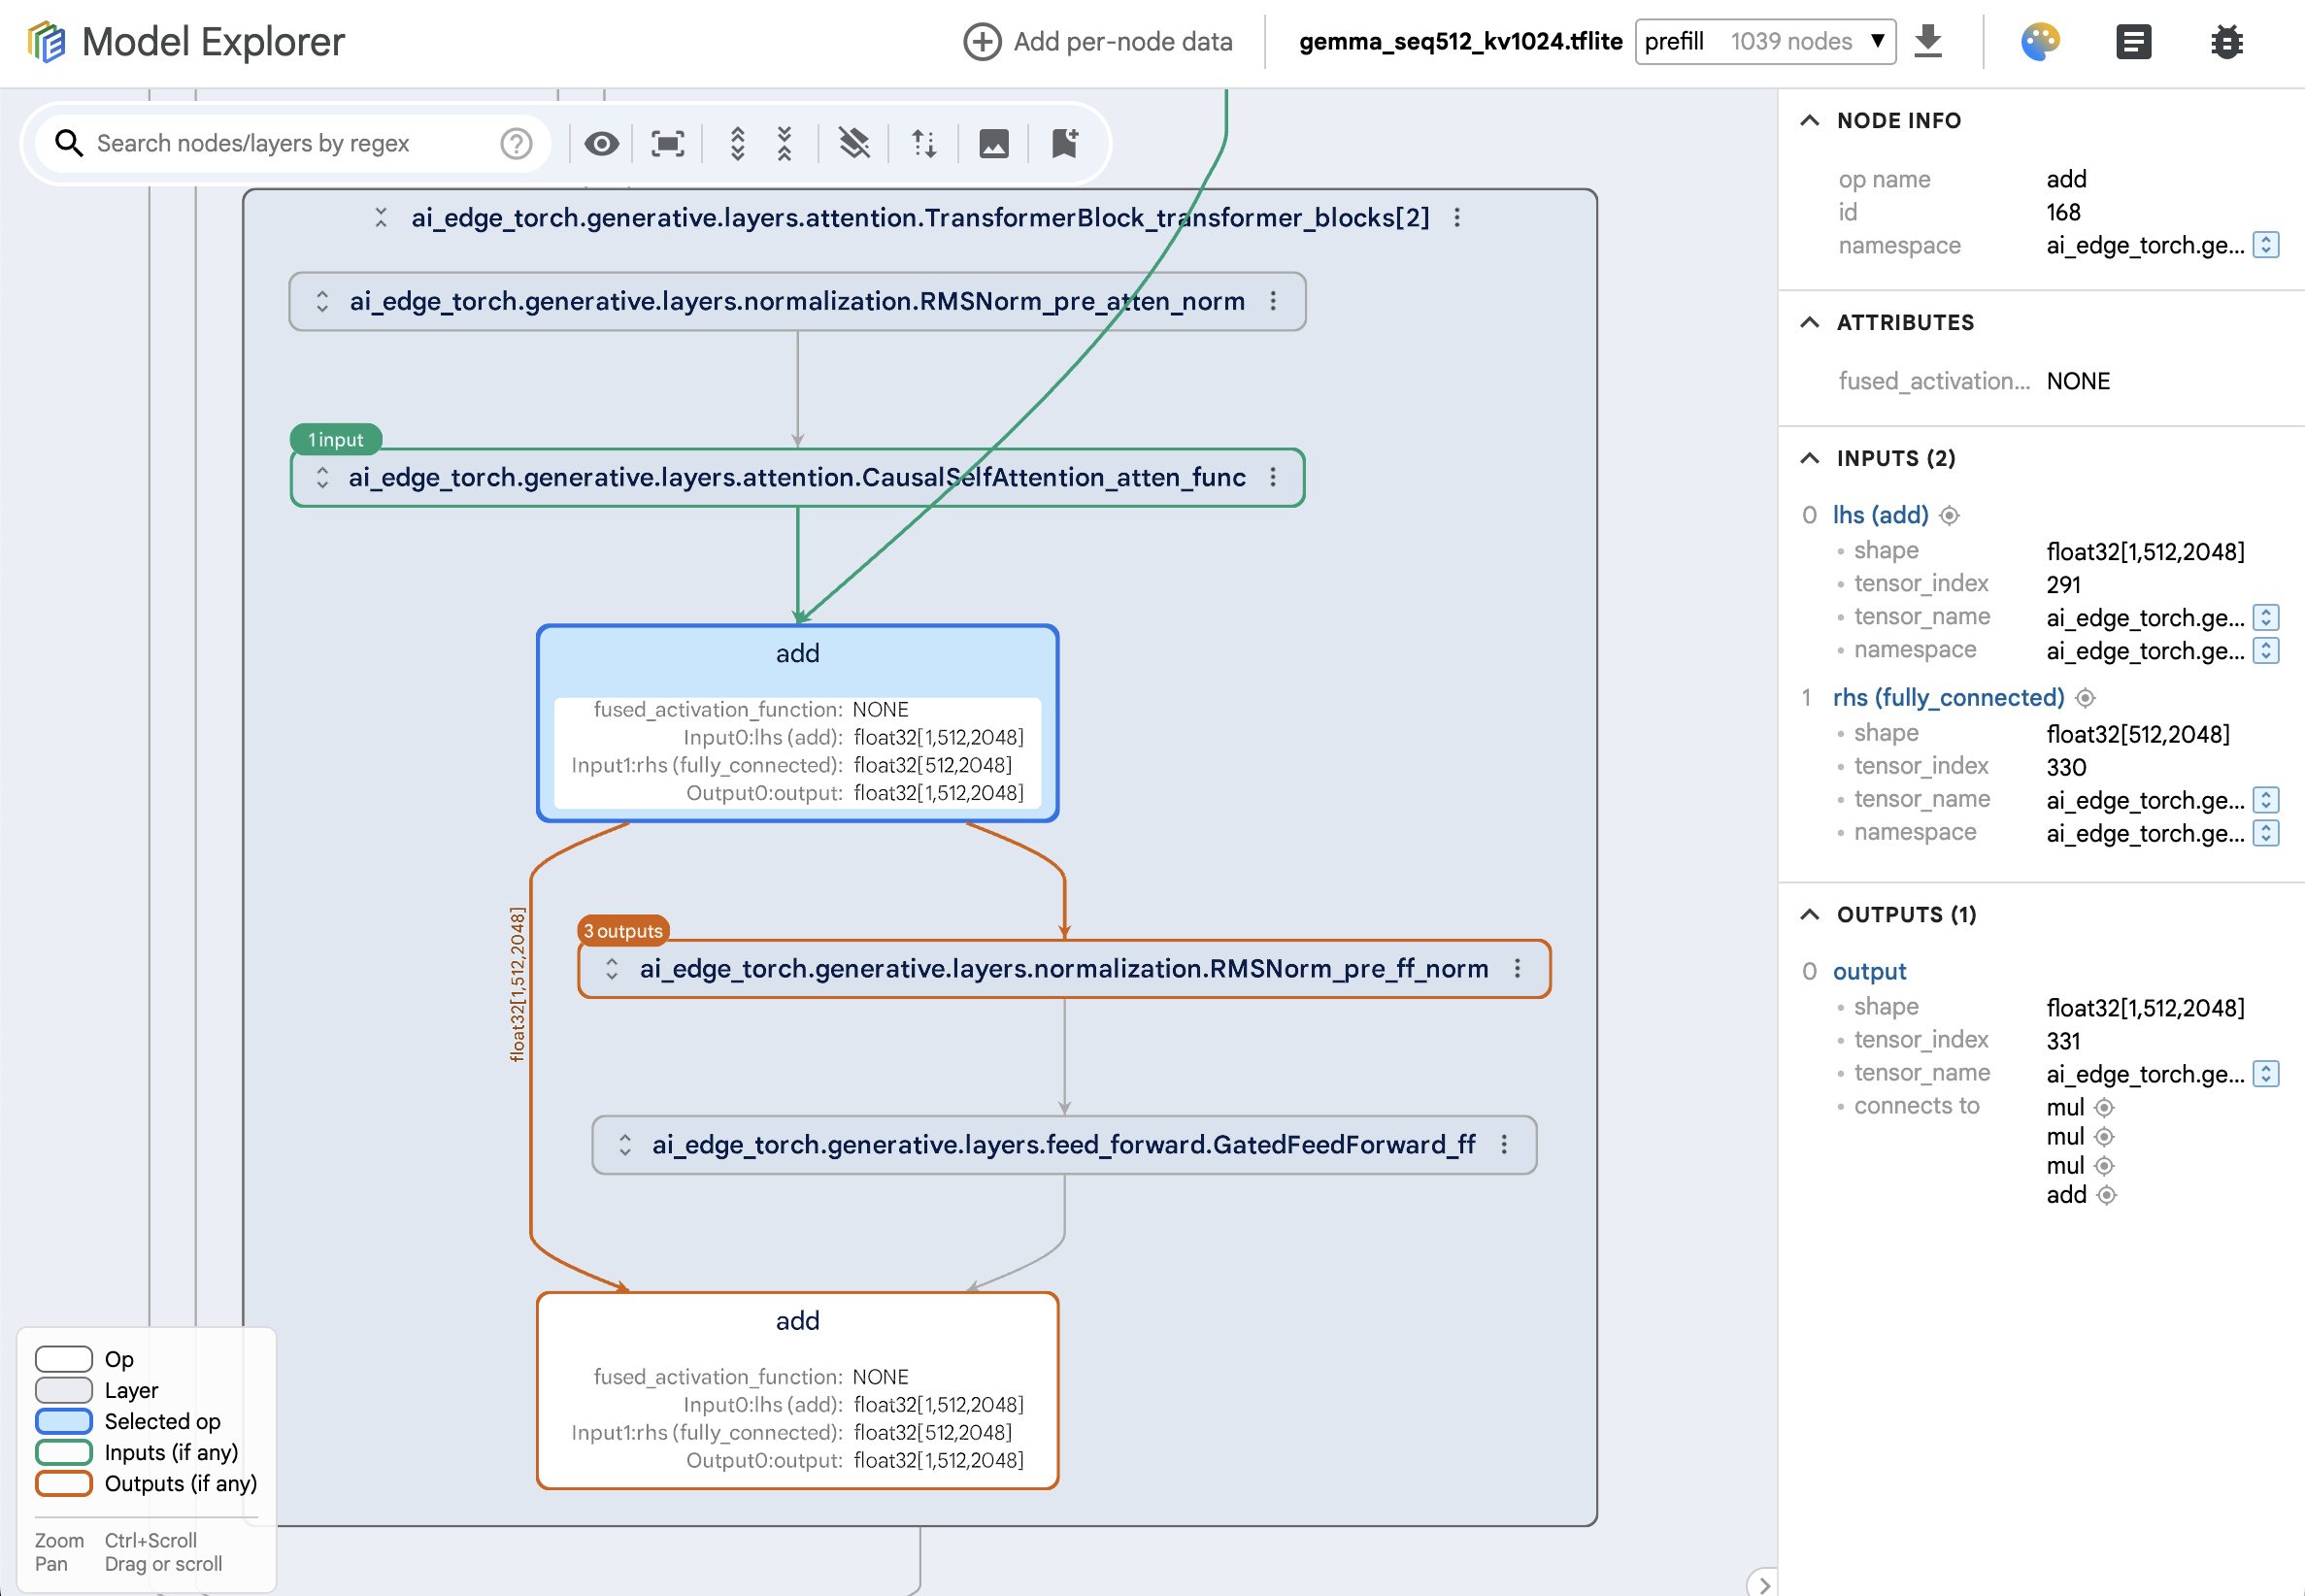
| Model Explorer's side-by-side comparison feature makes it easier to spot conversion-related issues. Navigate the graph layer by layer, diving deeper into the graph by expanding and collapsing sections. Inspect the internal structure and connections within graphs at the granularity you need. | Use Model Explorer to identify problematic operations affected by quantization. Sort ops by error metrics to find quality drops, get insights per layer, and compare different quantization results to find the ideal model size-quality trade-off. | Use Model Explorer to better understand the output from your benchmarking and debugging tools. Gain insights into which ops can run on GPU, sort ops by latency, and compare per-op performance across accelerators. |
Support for large models
Model Explorer is designed to render large models seamlessly. Thousands of nodes? No problem. The GPU-based rendering engine is capable of scaling up to smoothly render even very large models. And Model Explorer's unique approach to collapsing layers like a system of files and folders means that it's faster and easier to navigate.
Features designed to help you work faster
| Search | Split View | Data Overlays |
|---|---|---|
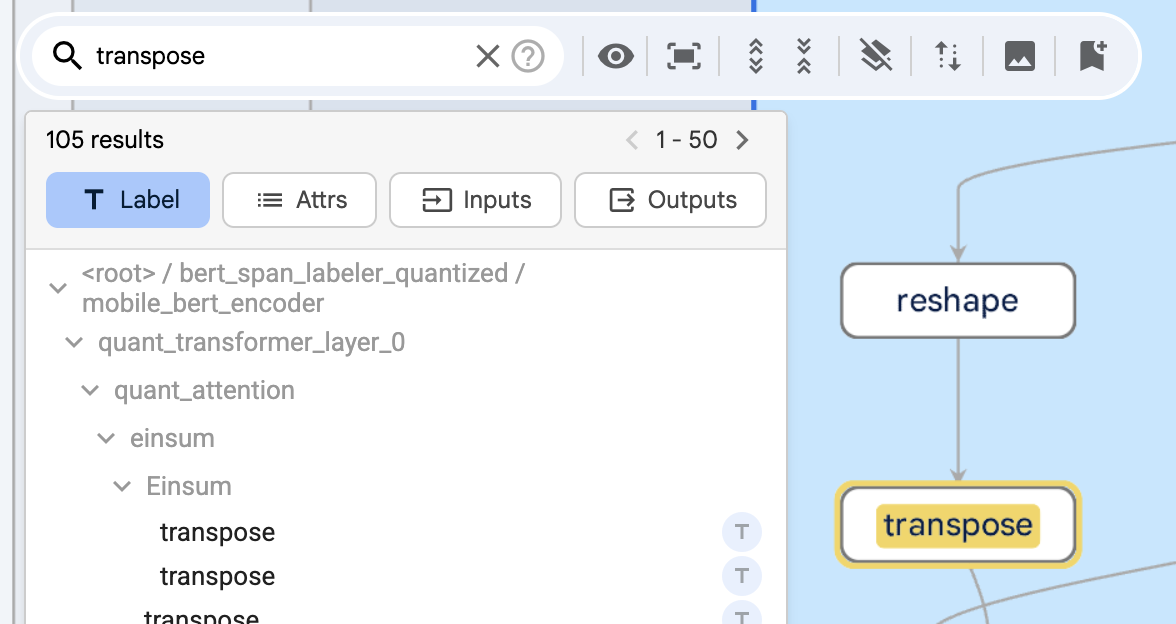
| Powerful regex-based search helps you locate, filter, and highlight
specific nodes.
|
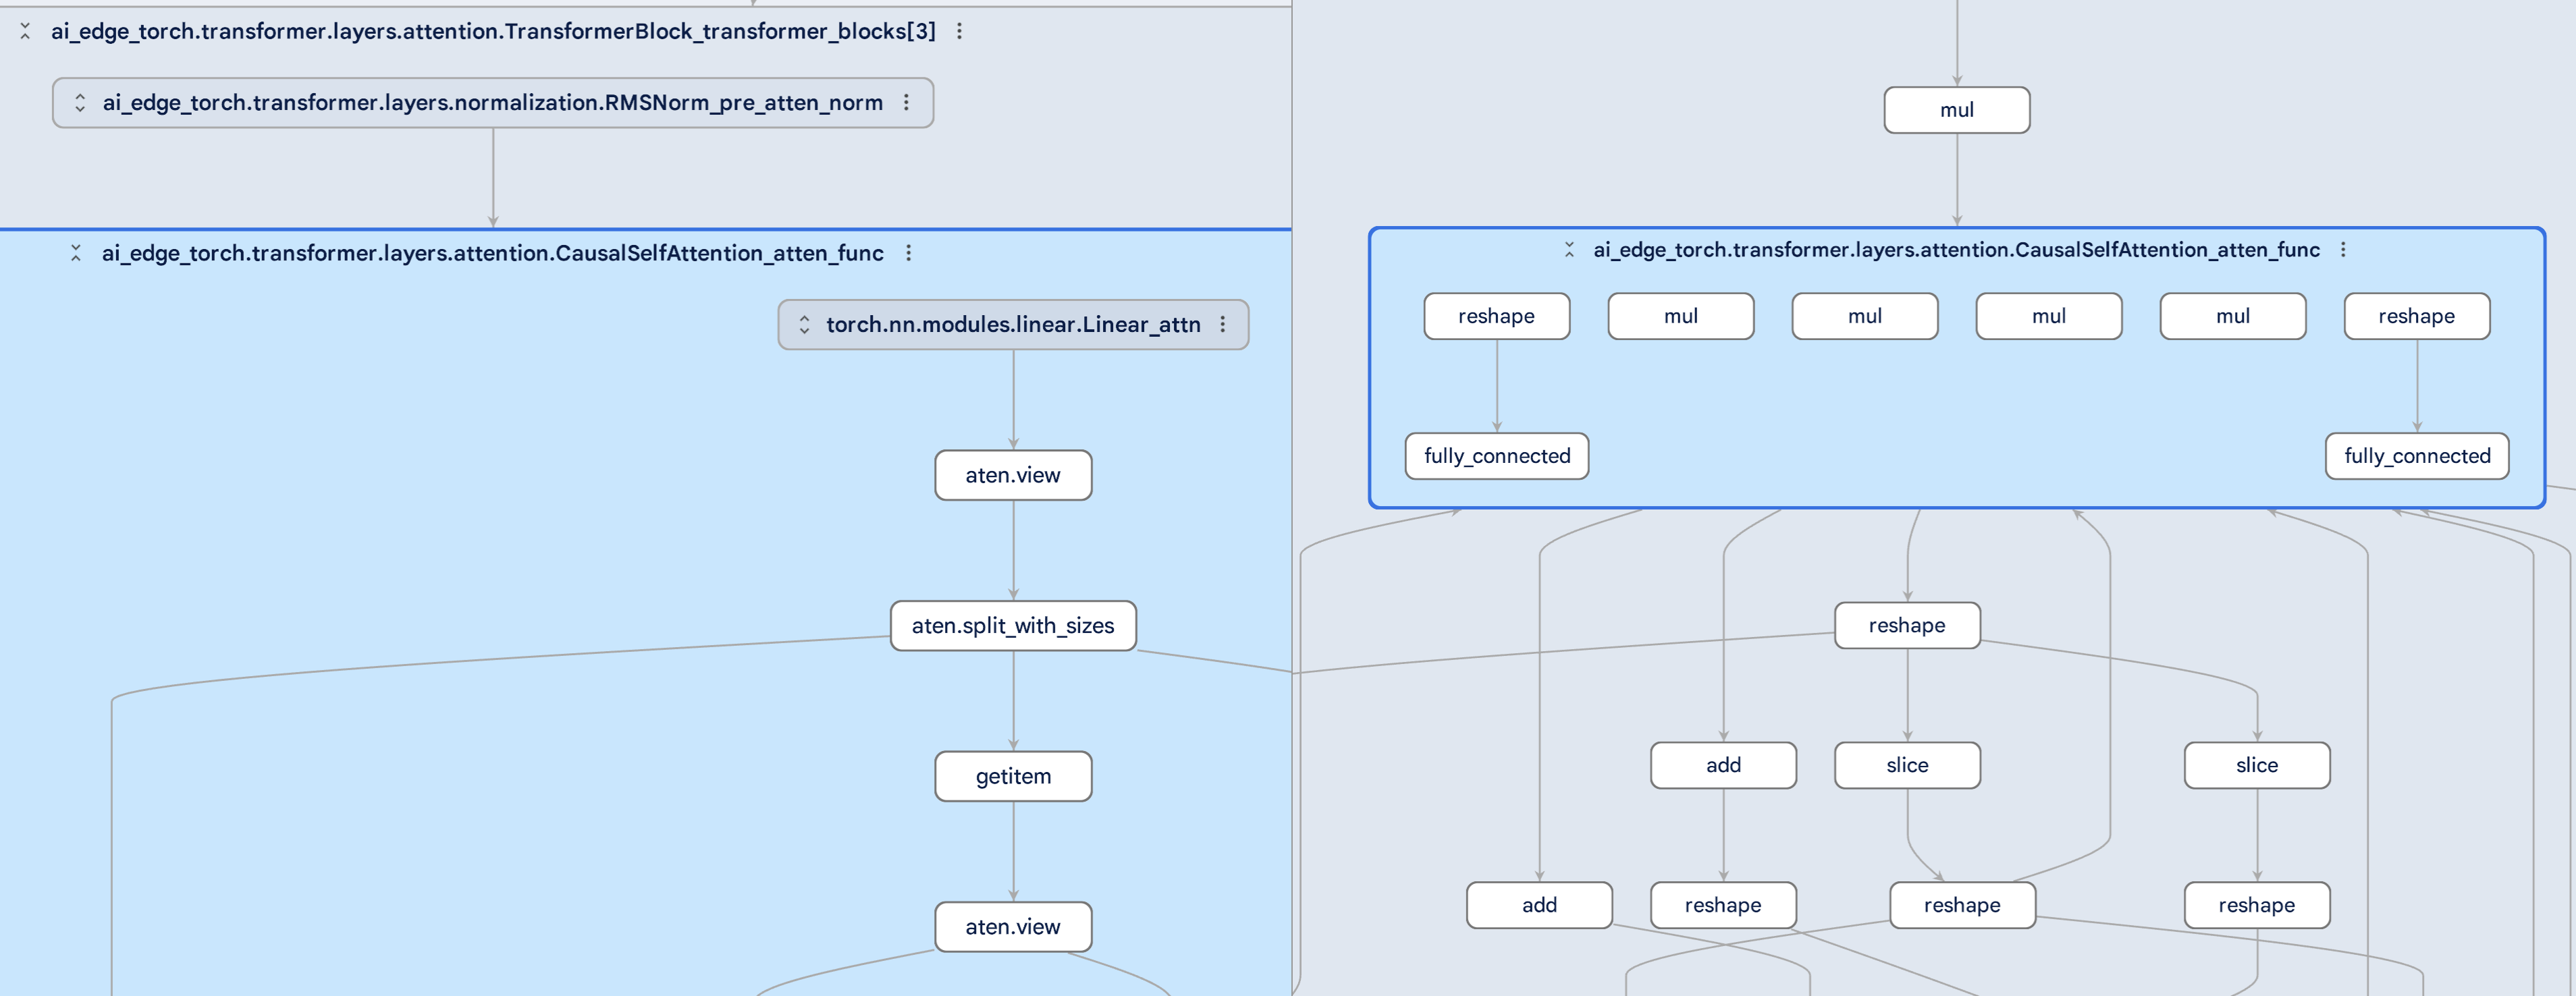
Load models side by side in the same tab for easy comparison.
|
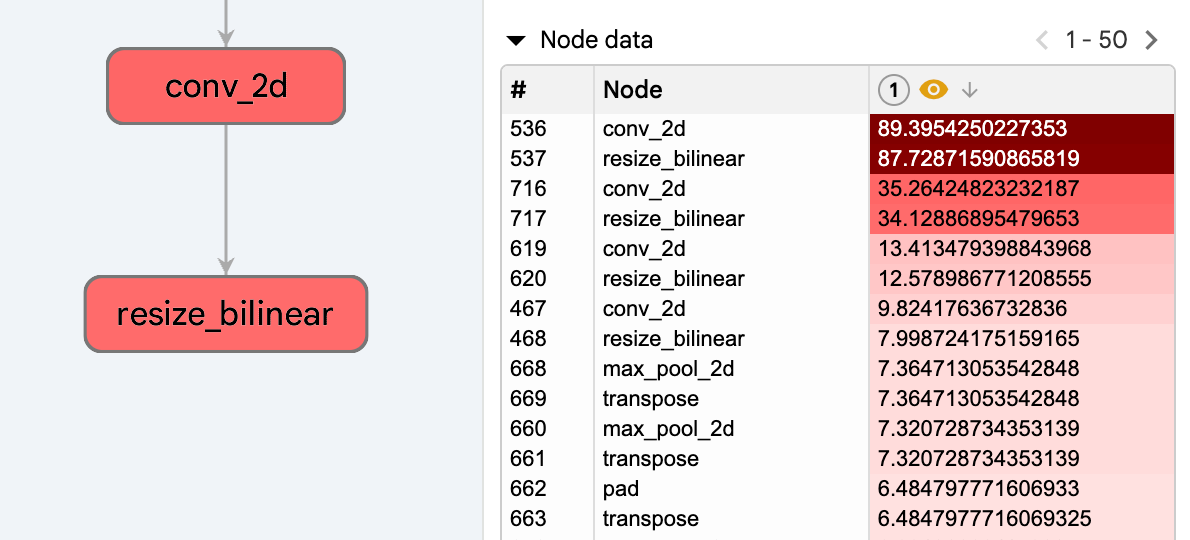
Load custom, node-specific data into Model Explorer to quickly
identify hot spots and other issues with your model.
|
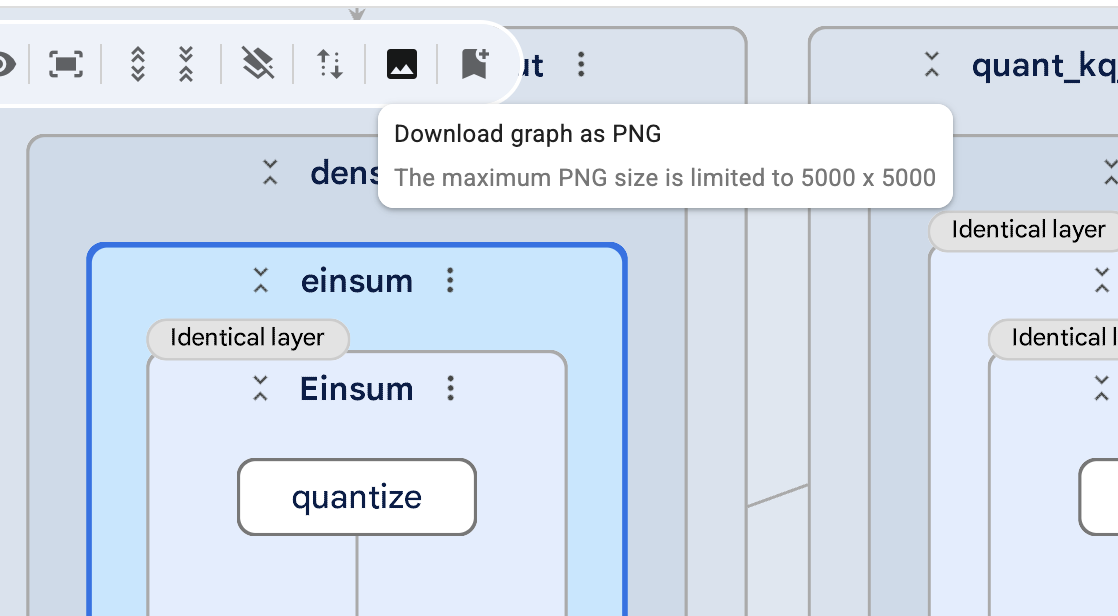
| Export to .png | Bookmarking | Easy to access metadata |
| With the click of a button, export an image of the graph to share
with your team.
|
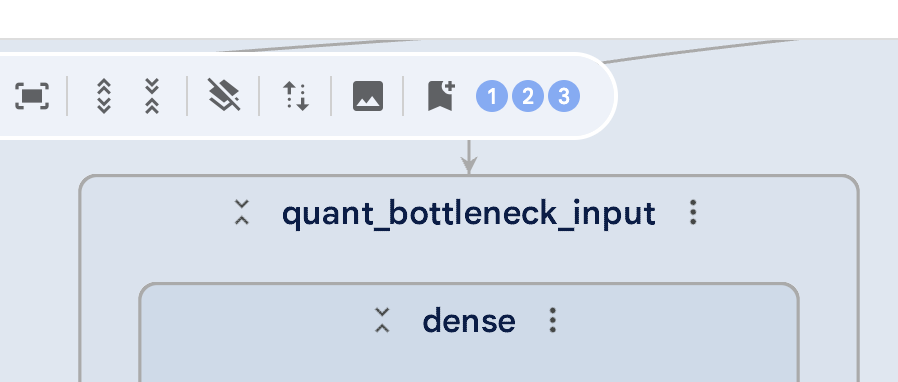
Save your location in the graph by adding bookmarks, making it easy
to jump between areas.
|
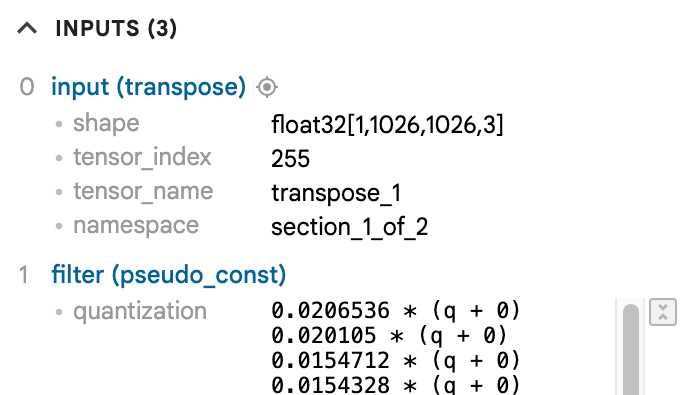
View tensor shapes, trace inputs and outputs, highlight identical
layers, see child node counts, and more.
|
Two ways to use Model Explorer
| Run it locally | Run it in a Colab notebook |
|---|---|
| Follow the easy installation instructions on GitHub to set up Model Explorer on your local machine. It runs in a browser window and all your data stays local. Supports Linux, Mac and Windows. | Model Explorer runs well in Colab, meaning you can integrate it into your existing model development workflow. Try the demo notebook or follow the installation instructions to add it to your own. |