
|
|
|
 在 GitHub 上查看原始碼 在 GitHub 上查看原始碼 |
總覽
本教學課程說明如何使用 Gemini API 的嵌入功能,以視覺化方式呈現及執行分群法。您將使用 t-SNE 視覺化呈現 20 個 Newsgroup 資料集的一部分,並使用 KMeans 演算法分群。
如要進一步瞭解如何從 Gemini API 產生的嵌入項目,請參閱 Python 快速入門導覽課程。
必要條件
您可以在 Google Colab 中執行本快速入門導覽課程。
如要在您自己的開發環境完成本快速入門導覽課程,請確保環境符合下列需求:
- Python 3.9 以上版本
- 安裝
jupyter以執行筆記本。
設定
首先,請下載並安裝 Gemini API Python 程式庫。
pip install -U -q google.generativeai
import re
import tqdm
import numpy as np
import pandas as pd
import matplotlib.pyplot as plt
import seaborn as sns

import google.generativeai as genai
import google.ai.generativelanguage as glm

# Used to securely store your API key
from google.colab import userdata

from sklearn.datasets import fetch_20newsgroups
from sklearn.manifold import TSNE
from sklearn.cluster import KMeans
from sklearn.metrics import confusion_matrix, ConfusionMatrixDisplay
取得 API 金鑰
您必須先取得 API 金鑰,才能使用 Gemini API。如果還沒有金鑰,請在 Google AI Studio 中按一下即可建立。
在 Colab 中,請在左側面板的「🔑?」下方,將密鑰新增至密鑰管理工具。輸入名稱 API_KEY。
取得 API 金鑰後,請傳遞至 SDK。操作方式有以下兩種:
- 將金鑰放入
GOOGLE_API_KEY環境變數中 (SDK 會自動從該處取得金鑰)。 - 將金鑰傳送至
genai.configure(api_key=...)
# Or use `os.getenv('API_KEY')` to fetch an environment variable.
API_KEY=userdata.get('API_KEY')

genai.configure(api_key=API_KEY)
for m in genai.list_models():
  if 'embedContent' in m.supported_generation_methods:
    print(m.name)
models/embedding-001
models/embedding-001
資料集
20 Newsgroups Text Dataset 則包含 20 個主題的 18,000 則新聞群組貼文,分為訓練和測試集。我們會根據特定日期前後發布的訊息,為訓練和測試資料集進行分割。在本教學課程中,您將使用訓練子集。
newsgroups_train = fetch_20newsgroups(subset='train')

# View list of class names for dataset
newsgroups_train.target_names
['alt.atheism',
 'comp.graphics',
 'comp.os.ms-windows.misc',
 'comp.sys.ibm.pc.hardware',
 'comp.sys.mac.hardware',
 'comp.windows.x',
 'misc.forsale',
 'rec.autos',
 'rec.motorcycles',
 'rec.sport.baseball',
 'rec.sport.hockey',
 'sci.crypt',
 'sci.electronics',
 'sci.med',
 'sci.space',
 'soc.religion.christian',
 'talk.politics.guns',
 'talk.politics.mideast',
 'talk.politics.misc',
 'talk.religion.misc']
以下是訓練集的第一個範例。
idx = newsgroups_train.data[0].index('Lines')
print(newsgroups_train.data[0][idx:])
Lines: 15

 I was wondering if anyone out there could enlighten me on this car I saw
the other day. It was a 2-door sports car, looked to be from the late 60s/
early 70s. It was called a Bricklin. The doors were really small. In addition,
the front bumper was separate from the rest of the body. This is
all I know. If anyone can tellme a model name, engine specs, years
of production, where this car is made, history, or whatever info you
have on this funky looking car, please e-mail.

Thanks,

- IL
   ---- brought to you by your neighborhood Lerxst ----
# Apply functions to remove names, emails, and extraneous words from data points in newsgroups.data
newsgroups_train.data = [re.sub(r'[\w\.-]+@[\w\.-]+', '', d) for d in newsgroups_train.data] # Remove email
newsgroups_train.data = [re.sub(r"\([^()]*\)", "", d) for d in newsgroups_train.data] # Remove names
newsgroups_train.data = [d.replace("From: ", "") for d in newsgroups_train.data] # Remove "From: "
newsgroups_train.data = [d.replace("\nSubject: ", "") for d in newsgroups_train.data] # Remove "\nSubject: "
# Put training points into a dataframe
df_train = pd.DataFrame(newsgroups_train.data, columns=['Text'])
df_train['Label'] = newsgroups_train.target
# Match label to target name index
df_train['Class Name'] = df_train['Label'].map(newsgroups_train.target_names.__getitem__)
# Retain text samples that can be used in the gecko model.
df_train = df_train[df_train['Text'].str.len() < 10000]

df_train
接下來,您將在訓練資料集中從 100 個資料點中對部分資料進行取樣,並捨棄幾個類別,以便在本教學課程中運用。選擇要比較的科學類別。
# Take a sample of each label category from df_train
SAMPLE_SIZE = 150
df_train = (df_train.groupby('Label', as_index = False)
                    .apply(lambda x: x.sample(SAMPLE_SIZE))
                    .reset_index(drop=True))

# Choose categories about science
df_train = df_train[df_train['Class Name'].str.contains('sci')]

# Reset the index
df_train = df_train.reset_index()
df_train
df_train['Class Name'].value_counts()
sci.crypt          150
sci.electronics    150
sci.med            150
sci.space          150
Name: Class Name, dtype: int64
建立嵌入
本節將說明如何使用 Gemini API 的嵌入功能,為 DataFrame 中的不同文字產生嵌入。
使用模型嵌入功能進行嵌入式的 API 變更 -001
針對新的嵌入模型「embedding-001」,有一個新的工作類型參數和選填的標題 (僅適用於 task_type=RETRIEVAL_DOCUMENT)。
這些新參數僅適用於最新的嵌入模型。工作類型如下:
| 工作類型 | 說明 |
|---|---|
| RETRIEVAL_QUERY | 指出指定文字是搜尋/擷取設定中的查詢。 |
| RETRIEVAL_DOCUMENT | 指定指定文字是搜尋/擷取設定中的文件。 |
| SEMANTIC_SIMILARITY | 指定指定文字將用於語意文字相似度 (STS)。 |
| 分類 | 指定將嵌入用於分類。 |
| 叢集 | 指定會使用嵌入進行叢集處理。 |
from tqdm.auto import tqdm
tqdm.pandas()

from google.api_core import retry

def make_embed_text_fn(model):

  @retry.Retry(timeout=300.0)
  def embed_fn(text: str) -> list[float]:
    # Set the task_type to CLUSTERING.
    embedding = genai.embed_content(model=model,
                                    content=text,
                                    task_type="clustering")
    return embedding["embedding"]

  return embed_fn

def create_embeddings(df):
  model = 'models/embedding-001'
  df['Embeddings'] = df['Text'].progress_apply(make_embed_text_fn(model))
  return df

df_train = create_embeddings(df_train)
0%| | 0/600 [00:00<?, ?it/s]
降低維度
文件嵌入向量的長度為 768。為了以視覺化方式呈現嵌入文件的方式,您必須套用縮減維度,因為您只能以 2D 或 3D 空間呈現嵌入。與情境相似的文件必須相鄰,而非不相似的文件。
len(df_train['Embeddings'][0])
768
# Convert df_train['Embeddings'] Pandas series to a np.array of float32
X = np.array(df_train['Embeddings'].to_list(), dtype=np.float32)
X.shape
(600, 768)
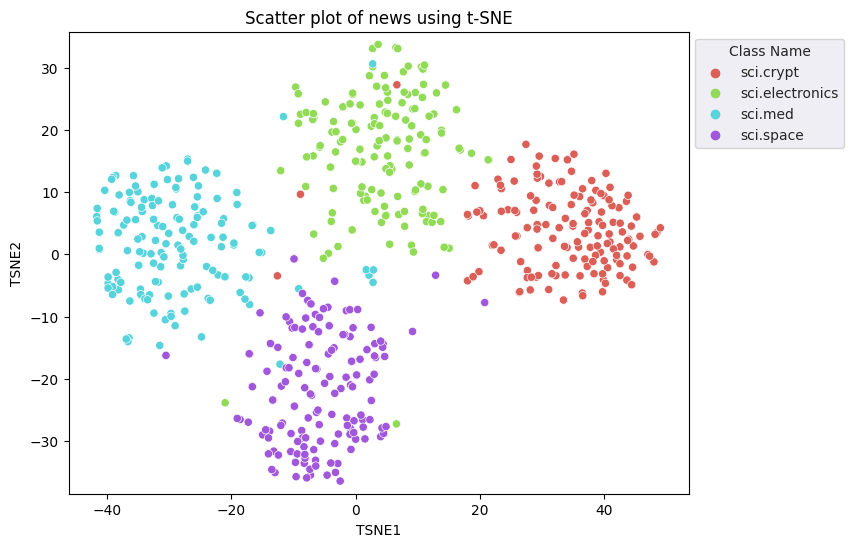
您將運用 t 分散式自訂相鄰技術嵌入 (t-SNE) 方法來減少維度性。這項技巧可以減少維度數量,同時保留叢集 (相近的點彼此接近)。對於原始資料,模型會嘗試建構其他資料點是「鄰」的分佈 (例如具有相同意義)。然後對目標函式進行最佳化,以在視覺呈現中維持類似的分佈。
tsne = TSNE(random_state=0, n_iter=1000)
tsne_results = tsne.fit_transform(X)
df_tsne = pd.DataFrame(tsne_results, columns=['TSNE1', 'TSNE2'])
df_tsne['Class Name'] = df_train['Class Name'] # Add labels column from df_train to df_tsne
df_tsne
fig, ax = plt.subplots(figsize=(8,6)) # Set figsize
sns.set_style('darkgrid', {"grid.color": ".6", "grid.linestyle": ":"})
sns.scatterplot(data=df_tsne, x='TSNE1', y='TSNE2', hue='Class Name', palette='hls')
sns.move_legend(ax, "upper left", bbox_to_anchor=(1, 1))
plt.title('Scatter plot of news using t-SNE');
plt.xlabel('TSNE1');
plt.ylabel('TSNE2');
plt.axis('equal')
(-46.191162300109866,
 53.521015357971194,
 -39.96646995544434,
 37.282975387573245)
比較 KMeans 的結果
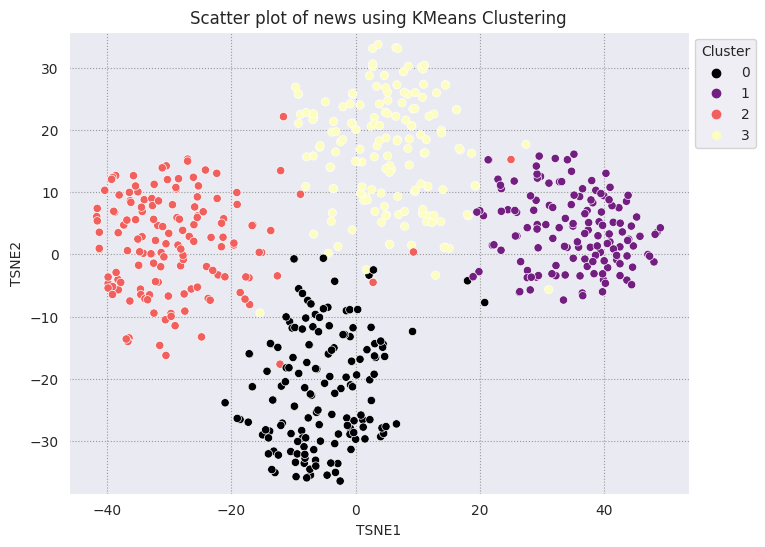
KMeans 分群法是一種常見的分群演算法,通常用於非監督式學習。疊代地判斷最佳的 k 中心點,並將每個樣本指派給最近的中心點。直接將嵌入內容輸入 KMeans 演算法,可比較嵌入的視覺化內容與機器學習演算法的成效。
# Apply KMeans
kmeans_model = KMeans(n_clusters=4, random_state=1, n_init='auto').fit(X)
labels = kmeans_model.fit_predict(X)
df_tsne['Cluster'] = labels
df_tsne
fig, ax = plt.subplots(figsize=(8,6)) # Set figsize
sns.set_style('darkgrid', {"grid.color": ".6", "grid.linestyle": ":"})
sns.scatterplot(data=df_tsne, x='TSNE1', y='TSNE2', hue='Cluster', palette='magma')
sns.move_legend(ax, "upper left", bbox_to_anchor=(1, 1))
plt.title('Scatter plot of news using KMeans Clustering');
plt.xlabel('TSNE1');
plt.ylabel('TSNE2');
plt.axis('equal')
(-46.191162300109866,
 53.521015357971194,
 -39.96646995544434,
 37.282975387573245)
def get_majority_cluster_per_group(df_tsne_cluster, class_names):
  class_clusters = dict()
  for c in class_names:
    # Get rows of dataframe that are equal to c
    rows = df_tsne_cluster.loc[df_tsne_cluster['Class Name'] == c]
    # Get majority value in Cluster column of the rows selected
    cluster = rows.Cluster.mode().values[0]
    # Populate mapping dictionary
    class_clusters[c] = cluster
  return class_clusters
classes = df_tsne['Class Name'].unique()
class_clusters = get_majority_cluster_per_group(df_tsne, classes)
class_clusters
{'sci.crypt': 1, 'sci.electronics': 3, 'sci.med': 2, 'sci.space': 0}
取得每個群組大部分的叢集,並查看該群組中實際成員的數量。
# Convert the Cluster column to use the class name
class_by_id = {v: k for k, v in class_clusters.items()}
df_tsne['Predicted'] = df_tsne['Cluster'].map(class_by_id.__getitem__)

# Filter to the correctly matched rows
correct = df_tsne[df_tsne['Class Name'] == df_tsne['Predicted']]

# Summarise, as a percentage
acc = correct['Class Name'].value_counts() / SAMPLE_SIZE
acc
sci.space          0.966667
sci.med            0.960000
sci.electronics    0.953333
sci.crypt          0.926667
Name: Class Name, dtype: float64
# Get predicted values by name
df_tsne['Predicted'] = ''
for idx, rows in df_tsne.iterrows():
  cluster = rows['Cluster']
  # Get key from mapping based on cluster value
  key = list(class_clusters.keys())[list(class_clusters.values()).index(cluster)]
  df_tsne.at[idx, 'Predicted'] = key

df_tsne
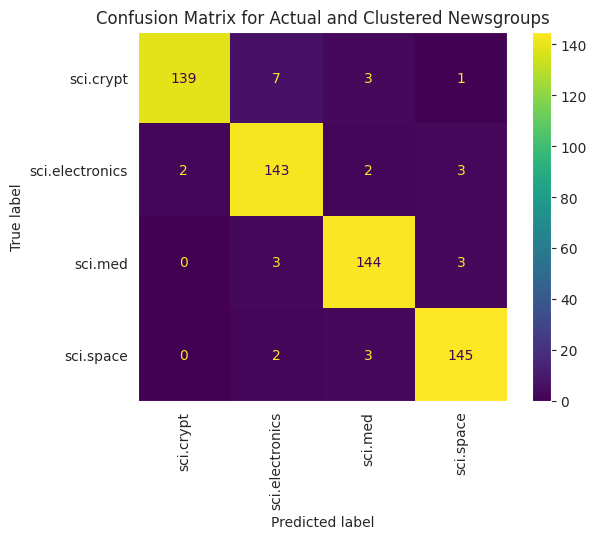
為了以更視覺化的方式呈現套用至資料的 KMeans 效能,您可以使用混淆矩陣。混淆矩陣可讓您評估分類模型的成效,而非準確率。你可以查看系統將點數分類有誤的點數。您會需要在上述 DataFrame 中收集的實際值和預測值。
cm = confusion_matrix(df_tsne['Class Name'].to_list(), df_tsne['Predicted'].to_list())
disp = ConfusionMatrixDisplay(confusion_matrix=cm,
                              display_labels=classes)
disp.plot(xticks_rotation='vertical')
plt.title('Confusion Matrix for Actual and Clustered Newsgroups');
plt.grid(False)
後續步驟
您現在已成功透過分群法建立嵌入式的視覺化圖表!嘗試使用自己的文字資料,以嵌入的方式呈現內容。您可以執行縮減維度,完成視覺化步驟。請注意,TSNE 很適合用來將輸入分群,但需要較長時間才能收斂,或是在本機 Minima 卡住。如果遇到這個問題,建議採用的另一項技巧是主要元件分析 (PCA)。
除了 KMeans 以外,還有其他叢集演算法,例如密度型空間分群 (DBSCAN)。
如要瞭解如何在 Gemini API 中使用其他服務,請參閱 Python 快速入門導覽課程。如要進一步瞭解如何使用嵌入,請查看可用的範例。如要瞭解如何從頭開始建立,請參閱 TensorFlow 的Word 嵌入教學課程。