
|
|
|
 前往 GitHub 查看原始碼 前往 GitHub 查看原始碼 |
總覽
在這個筆記本中,您將瞭解如何使用 Gemini API 產生的嵌入項目訓練模型,依據主題將不同類型的新聞群組貼文分類。
在這個教學課程中,您將訓練分類器來預測新聞群組貼文所屬的類別。
先備知識
您可以在 Google Colab 中執行本快速入門導覽課程。
如要在您的開發環境完成本快速入門導覽課程,請確保您的環境符合下列需求:
- Python 3.9 以上版本
- 安裝
jupyter以執行筆記本。
設定
首先,下載並安裝 Gemini API Python 程式庫。
pip install -U -q google.generativeai
import re
import tqdm
import keras
import numpy as np
import pandas as pd

import google.generativeai as genai

# Used to securely store your API key
from google.colab import userdata

import seaborn as sns
import matplotlib.pyplot as plt

from keras import layers
from matplotlib.ticker import MaxNLocator
from sklearn.datasets import fetch_20newsgroups
import sklearn.metrics as skmetrics
取得 API 金鑰
您必須先取得 API 金鑰,才能使用 Gemini API。如果您尚未建立金鑰,請在 Google AI Studio 中按一下滑鼠即可建立金鑰。
在 Colab 左側面板的「🔑?」下方,將金鑰新增至密鑰管理員。輸入名稱 API_KEY。
取得 API 金鑰後,請將其傳遞至 SDK。操作方式有以下兩種:
- 將金鑰放入
GOOGLE_API_KEY環境變數中 (SDK 會自動從中取得)。 - 將金鑰傳遞至
genai.configure(api_key=...)
# Or use `os.getenv('API_KEY')` to fetch an environment variable.
API_KEY=userdata.get('API_KEY')

genai.configure(api_key=API_KEY)
for m in genai.list_models():
  if 'embedContent' in m.supported_generation_methods:
    print(m.name)
models/embedding-001
models/embedding-001
資料集
20 Newsgroups Text Dataset 包含 20 個主題的 18,000 個新聞群組貼文,分為訓練和測試集。訓練資料集和測試資料集的分割依據,是特定日期前後發布的訊息。在本教學課程中,您將使用訓練和測試資料集的一部分。您將預先處理資料,並將資料整理到 Pandas DataFrame。
newsgroups_train = fetch_20newsgroups(subset='train')
newsgroups_test = fetch_20newsgroups(subset='test')

# View list of class names for dataset
newsgroups_train.target_names
['alt.atheism',
 'comp.graphics',
 'comp.os.ms-windows.misc',
 'comp.sys.ibm.pc.hardware',
 'comp.sys.mac.hardware',
 'comp.windows.x',
 'misc.forsale',
 'rec.autos',
 'rec.motorcycles',
 'rec.sport.baseball',
 'rec.sport.hockey',
 'sci.crypt',
 'sci.electronics',
 'sci.med',
 'sci.space',
 'soc.religion.christian',
 'talk.politics.guns',
 'talk.politics.mideast',
 'talk.politics.misc',
 'talk.religion.misc']
以下是訓練集的資料點範例。
idx = newsgroups_train.data[0].index('Lines')
print(newsgroups_train.data[0][idx:])
Lines: 15

 I was wondering if anyone out there could enlighten me on this car I saw
the other day. It was a 2-door sports car, looked to be from the late 60s/
early 70s. It was called a Bricklin. The doors were really small. In addition,
the front bumper was separate from the rest of the body. This is
all I know. If anyone can tellme a model name, engine specs, years
of production, where this car is made, history, or whatever info you
have on this funky looking car, please e-mail.

Thanks,

- IL
   ---- brought to you by your neighborhood Lerxst ----
現在您要開始預先處理這個教學課程的資料。移除名稱、電子郵件地址或文字多餘部分 (例如 "From: "、"\nSubject: ") 的所有機密資訊。將資訊整理成 Pandas DataFrame,以便更清晰易讀。
def preprocess_newsgroup_data(newsgroup_dataset):
  # Apply functions to remove names, emails, and extraneous words from data points in newsgroups.data
  newsgroup_dataset.data = [re.sub(r'[\w\.-]+@[\w\.-]+', '', d) for d in newsgroup_dataset.data] # Remove email
  newsgroup_dataset.data = [re.sub(r"\([^()]*\)", "", d) for d in newsgroup_dataset.data] # Remove names
  newsgroup_dataset.data = [d.replace("From: ", "") for d in newsgroup_dataset.data] # Remove "From: "
  newsgroup_dataset.data = [d.replace("\nSubject: ", "") for d in newsgroup_dataset.data] # Remove "\nSubject: "

  # Cut off each text entry after 5,000 characters
  newsgroup_dataset.data = [d[0:5000] if len(d) > 5000 else d for d in newsgroup_dataset.data]

  # Put data points into dataframe
  df_processed = pd.DataFrame(newsgroup_dataset.data, columns=['Text'])
  df_processed['Label'] = newsgroup_dataset.target
  # Match label to target name index
  df_processed['Class Name'] = ''
  for idx, row in df_processed.iterrows():
    df_processed.at[idx, 'Class Name'] = newsgroup_dataset.target_names[row['Label']]

  return df_processed
# Apply preprocessing function to training and test datasets
df_train = preprocess_newsgroup_data(newsgroups_train)
df_test = preprocess_newsgroup_data(newsgroups_test)

df_train.head()
接下來,您要在訓練資料集中收集 100 個資料點,並捨棄幾個類別以執行本教學課程,以對部分資料進行取樣。選擇要比較的科學類別。
def sample_data(df, num_samples, classes_to_keep):
  df = df.groupby('Label', as_index = False).apply(lambda x: x.sample(num_samples)).reset_index(drop=True)

  df = df[df['Class Name'].str.contains(classes_to_keep)]

  # Reset the encoding of the labels after sampling and dropping certain categories
  df['Class Name'] = df['Class Name'].astype('category')
  df['Encoded Label'] = df['Class Name'].cat.codes

  return df
TRAIN_NUM_SAMPLES = 100
TEST_NUM_SAMPLES = 25
CLASSES_TO_KEEP = 'sci' # Class name should contain 'sci' in it to keep science categories
df_train = sample_data(df_train, TRAIN_NUM_SAMPLES, CLASSES_TO_KEEP)
df_test = sample_data(df_test, TEST_NUM_SAMPLES, CLASSES_TO_KEEP)
df_train.value_counts('Class Name')
Class Name
sci.crypt          100
sci.electronics    100
sci.med            100
sci.space          100
dtype: int64
df_test.value_counts('Class Name')
Class Name
sci.crypt          25
sci.electronics    25
sci.med            25
sci.space          25
dtype: int64
建立嵌入
本節將說明如何使用 Gemini API 的嵌入功能,為一段文字產生嵌入。如要進一步瞭解嵌入,請參閱嵌入指南。
API 變更為 Embeddingsembedding-001
新的嵌入模型有一個新的工作類型參數和選用標題 (僅適用於 task_type=RETRIEVAL_DOCUMENT)。
這些新參數僅適用於最新的嵌入模型。工作類型如下:
| 工作類型 | 說明 |
|---|---|
| RETRIEVAL_QUERY | 指定指定文字是搜尋/擷取設定中的查詢。 |
| RETRIEVAL_DOCUMENT | 指定文字是搜尋/擷取設定中的文件。 |
| SEMANTIC_SIMILARITY | 指定指定文字將用於語意文字相似度 (STS)。 |
| 分類 | 指定要將嵌入用於分類。 |
| 叢集 | 指定嵌入將用於分群。 |
from tqdm.auto import tqdm
tqdm.pandas()

from google.api_core import retry

def make_embed_text_fn(model):

  @retry.Retry(timeout=300.0)
  def embed_fn(text: str) -> list[float]:
    # Set the task_type to CLASSIFICATION.
    embedding = genai.embed_content(model=model,
                                    content=text,
                                    task_type="classification")
    return embedding['embedding']

  return embed_fn

def create_embeddings(model, df):
  df['Embeddings'] = df['Text'].progress_apply(make_embed_text_fn(model))
  return df
model = 'models/embedding-001'
df_train = create_embeddings(model, df_train)
df_test = create_embeddings(model, df_test)
0%|          | 0/400 [00:00<?, ?it/s]
0%|          | 0/100 [00:00<?, ?it/s]
df_train.head()
建立簡易分類模型
您會在這裡定義一個隱藏層和單一類別機率輸出結果的簡易模型。預測結果會對應一段文字屬於特定新聞類別的機率。建構模型時,Keras 會自動重組資料點。
def build_classification_model(input_size: int, num_classes: int) -> keras.Model:
  inputs = x = keras.Input(input_size)
  x = layers.Dense(input_size, activation='relu')(x)
  x = layers.Dense(num_classes, activation='sigmoid')(x)
  return keras.Model(inputs=[inputs], outputs=x)
# Derive the embedding size from the first training element.
embedding_size = len(df_train['Embeddings'].iloc[0])

# Give your model a different name, as you have already used the variable name 'model'
classifier = build_classification_model(embedding_size, len(df_train['Class Name'].unique()))
classifier.summary()

classifier.compile(loss = keras.losses.SparseCategoricalCrossentropy(from_logits=True),
                   optimizer = keras.optimizers.Adam(learning_rate=0.001),
                   metrics=['accuracy'])
Model: "model"
_________________________________________________________________
 Layer (type)                Output Shape              Param #
=================================================================
 input_1 (InputLayer)        [(None, 768)]             0

 dense (Dense)               (None, 768)               590592

 dense_1 (Dense)             (None, 4)                 3076

=================================================================
Total params: 593668 (2.26 MB)
Trainable params: 593668 (2.26 MB)
Non-trainable params: 0 (0.00 Byte)
_________________________________________________________________
embedding_size
768
訓練模型將新聞群組分類
最後,您可以訓練簡單的模型。使用少量訓練週期,避免過度配適。第一個週期需要比其餘週期更長,因為嵌入只需要計算一次。
NUM_EPOCHS = 20
BATCH_SIZE = 32

# Split the x and y components of the train and validation subsets.
y_train = df_train['Encoded Label']
x_train = np.stack(df_train['Embeddings'])
y_val = df_test['Encoded Label']
x_val = np.stack(df_test['Embeddings'])

# Train the model for the desired number of epochs.
callback = keras.callbacks.EarlyStopping(monitor='accuracy', patience=3)

history = classifier.fit(x=x_train,
                         y=y_train,
                         validation_data=(x_val, y_val),
                         callbacks=[callback],
                         batch_size=BATCH_SIZE,
                         epochs=NUM_EPOCHS,)
Epoch 1/20
/usr/local/lib/python3.10/dist-packages/keras/src/backend.py:5729: UserWarning: "`sparse_categorical_crossentropy` received `from_logits=True`, but the `output` argument was produced by a Softmax activation and thus does not represent logits. Was this intended?
  output, from_logits = _get_logits(
13/13 [==============================] - 1s 30ms/step - loss: 1.2141 - accuracy: 0.6675 - val_loss: 0.9801 - val_accuracy: 0.8800
Epoch 2/20
13/13 [==============================] - 0s 12ms/step - loss: 0.7580 - accuracy: 0.9400 - val_loss: 0.6061 - val_accuracy: 0.9300
Epoch 3/20
13/13 [==============================] - 0s 13ms/step - loss: 0.4249 - accuracy: 0.9525 - val_loss: 0.3902 - val_accuracy: 0.9200
Epoch 4/20
13/13 [==============================] - 0s 13ms/step - loss: 0.2561 - accuracy: 0.9625 - val_loss: 0.2597 - val_accuracy: 0.9400
Epoch 5/20
13/13 [==============================] - 0s 13ms/step - loss: 0.1693 - accuracy: 0.9700 - val_loss: 0.2145 - val_accuracy: 0.9300
Epoch 6/20
13/13 [==============================] - 0s 13ms/step - loss: 0.1240 - accuracy: 0.9850 - val_loss: 0.1801 - val_accuracy: 0.9600
Epoch 7/20
13/13 [==============================] - 0s 21ms/step - loss: 0.0931 - accuracy: 0.9875 - val_loss: 0.1623 - val_accuracy: 0.9400
Epoch 8/20
13/13 [==============================] - 0s 16ms/step - loss: 0.0736 - accuracy: 0.9925 - val_loss: 0.1418 - val_accuracy: 0.9600
Epoch 9/20
13/13 [==============================] - 0s 20ms/step - loss: 0.0613 - accuracy: 0.9925 - val_loss: 0.1315 - val_accuracy: 0.9700
Epoch 10/20
13/13 [==============================] - 0s 20ms/step - loss: 0.0479 - accuracy: 0.9975 - val_loss: 0.1235 - val_accuracy: 0.9600
Epoch 11/20
13/13 [==============================] - 0s 19ms/step - loss: 0.0399 - accuracy: 0.9975 - val_loss: 0.1219 - val_accuracy: 0.9700
Epoch 12/20
13/13 [==============================] - 0s 21ms/step - loss: 0.0326 - accuracy: 0.9975 - val_loss: 0.1158 - val_accuracy: 0.9700
Epoch 13/20
13/13 [==============================] - 0s 19ms/step - loss: 0.0263 - accuracy: 1.0000 - val_loss: 0.1127 - val_accuracy: 0.9700
Epoch 14/20
13/13 [==============================] - 0s 17ms/step - loss: 0.0229 - accuracy: 1.0000 - val_loss: 0.1123 - val_accuracy: 0.9700
Epoch 15/20
13/13 [==============================] - 0s 20ms/step - loss: 0.0195 - accuracy: 1.0000 - val_loss: 0.1063 - val_accuracy: 0.9700
Epoch 16/20
13/13 [==============================] - 0s 17ms/step - loss: 0.0172 - accuracy: 1.0000 - val_loss: 0.1070 - val_accuracy: 0.9700
評估模型效能
使用 Keras Model.evaluate 取得測試資料集的損失和準確率。
classifier.evaluate(x=x_val, y=y_val, return_dict=True)
4/4 [==============================] - 0s 4ms/step - loss: 0.1070 - accuracy: 0.9700
{'loss': 0.10700511932373047, 'accuracy': 0.9700000286102295}
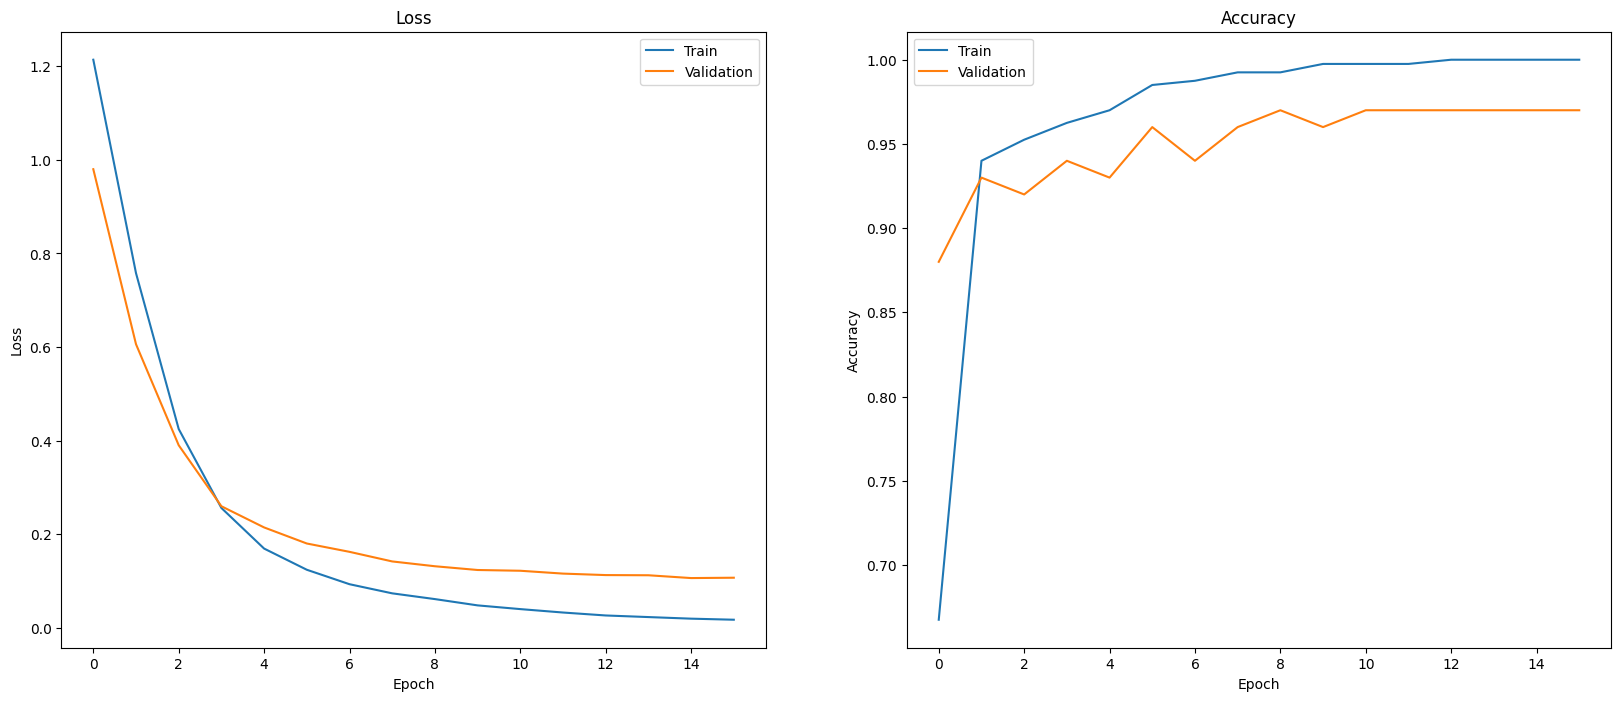
評估模型成效的其中一種方法是以圖表呈現分類器成效。使用 plot_history 查看不同週期的損失和準確率趨勢。
def plot_history(history):
  """
    Plotting training and validation learning curves.

    Args:
      history: model history with all the metric measures
  """
  fig, (ax1, ax2) = plt.subplots(1,2)
  fig.set_size_inches(20, 8)

  # Plot loss
  ax1.set_title('Loss')
  ax1.plot(history.history['loss'], label = 'train')
  ax1.plot(history.history['val_loss'], label = 'test')
  ax1.set_ylabel('Loss')

  ax1.set_xlabel('Epoch')
  ax1.legend(['Train', 'Validation'])

  # Plot accuracy
  ax2.set_title('Accuracy')
  ax2.plot(history.history['accuracy'],  label = 'train')
  ax2.plot(history.history['val_accuracy'], label = 'test')
  ax2.set_ylabel('Accuracy')
  ax2.set_xlabel('Epoch')
  ax2.legend(['Train', 'Validation'])

  plt.show()

plot_history(history)
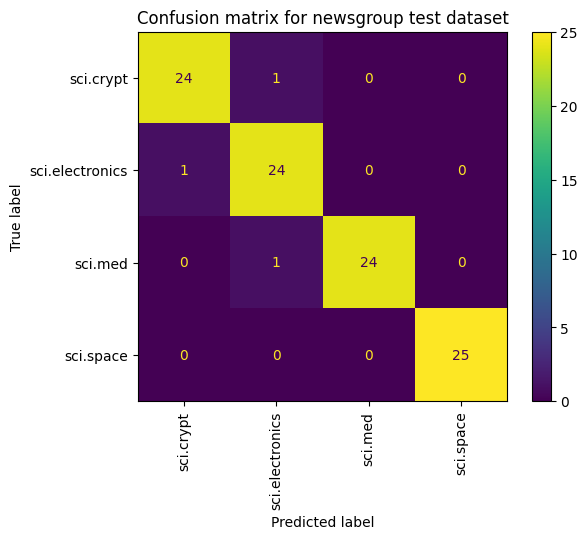
除了測量損失和準確率,另一種方法也能查看模型效能,方法是使用混淆矩陣。混淆矩陣可讓您評估分類模型在準確率以外的表現。您可以查看系統分類錯誤的點數。為了建立這個多類別分類問題的混淆矩陣,請取得測試集和預測值中的實際值。
首先,使用 Model.predict() 為驗證集中的每個範例產生預測類別。
y_hat = classifier.predict(x=x_val)
y_hat = np.argmax(y_hat, axis=1)
4/4 [==============================] - 0s 4ms/step
labels_dict = dict(zip(df_test['Class Name'], df_test['Encoded Label']))
labels_dict
{'sci.crypt': 0, 'sci.electronics': 1, 'sci.med': 2, 'sci.space': 3}
cm = skmetrics.confusion_matrix(y_val, y_hat)
disp = skmetrics.ConfusionMatrixDisplay(confusion_matrix=cm,
                              display_labels=labels_dict.keys())
disp.plot(xticks_rotation='vertical')
plt.title('Confusion matrix for newsgroup test dataset');
plt.grid(False)
後續步驟
如要進一步瞭解如何使用嵌入功能,請參閱下列其他教學課程: