
|
|
|
 查看 GitHub 上的源代码 查看 GitHub 上的源代码
|
概览
本教程演示了如何使用 Gemini API 中的嵌入直观呈现和执行聚类。您将使用 t-SNE 直观呈现 20 个 Newsgroup 数据集的一个子集,并使用 KMeans 算法对该子集进行聚类。
如需详细了解如何开始使用 Gemini API 生成的嵌入,请参阅 Python 快速入门。
前提条件
您可以在 Google Colab 中运行本快速入门。
如需在您自己的开发环境中完成本快速入门,请确保您的环境满足以下要求:
- Python 3.9 及更高版本
- 安装了
jupyter,用于运行笔记本。
初始设置
首先,下载并安装 Gemini API Python 库。
pip install -U -q google.generativeai
import re
import tqdm
import numpy as np
import pandas as pd
import matplotlib.pyplot as plt
import seaborn as sns

import google.generativeai as genai
import google.ai.generativelanguage as glm

# Used to securely store your API key
from google.colab import userdata

from sklearn.datasets import fetch_20newsgroups
from sklearn.manifold import TSNE
from sklearn.cluster import KMeans
from sklearn.metrics import confusion_matrix, ConfusionMatrixDisplay
获取 API 密钥
您必须先获取 API 密钥,然后才能使用 Gemini API。如果您还没有密钥,请在 Google AI Studio 中一键创建。
在 Colab 中,将密钥添加到 Secret 管理器中左侧面板中的“🔑?”下。将其命名为 API_KEY。
获得 API 密钥后,将其传递给 SDK。可以通过以下两种方法实现此目的:
- 将密钥放在
GOOGLE_API_KEY环境变量中(SDK 会自动从该变量中获取密钥)。 - 将密钥传递给
genai.configure(api_key=...)
# Or use `os.getenv('API_KEY')` to fetch an environment variable.
API_KEY=userdata.get('API_KEY')

genai.configure(api_key=API_KEY)
for m in genai.list_models():
  if 'embedContent' in m.supported_generation_methods:
    print(m.name)
models/embedding-001
models/embedding-001
数据集
20 个新闻组文本数据集包含 18,000 个新闻组帖子,涵盖 20 个主题,分为训练集和测试集。训练数据集和测试数据集之间的拆分依据是在特定日期之前和之后发布的消息。在本教程中,您将使用训练子集。
newsgroups_train = fetch_20newsgroups(subset='train')

# View list of class names for dataset
newsgroups_train.target_names
['alt.atheism',
 'comp.graphics',
 'comp.os.ms-windows.misc',
 'comp.sys.ibm.pc.hardware',
 'comp.sys.mac.hardware',
 'comp.windows.x',
 'misc.forsale',
 'rec.autos',
 'rec.motorcycles',
 'rec.sport.baseball',
 'rec.sport.hockey',
 'sci.crypt',
 'sci.electronics',
 'sci.med',
 'sci.space',
 'soc.religion.christian',
 'talk.politics.guns',
 'talk.politics.mideast',
 'talk.politics.misc',
 'talk.religion.misc']
这是训练集中的第一个样本。
idx = newsgroups_train.data[0].index('Lines')
print(newsgroups_train.data[0][idx:])
Lines: 15

 I was wondering if anyone out there could enlighten me on this car I saw
the other day. It was a 2-door sports car, looked to be from the late 60s/
early 70s. It was called a Bricklin. The doors were really small. In addition,
the front bumper was separate from the rest of the body. This is
all I know. If anyone can tellme a model name, engine specs, years
of production, where this car is made, history, or whatever info you
have on this funky looking car, please e-mail.

Thanks,

- IL
   ---- brought to you by your neighborhood Lerxst ----
# Apply functions to remove names, emails, and extraneous words from data points in newsgroups.data
newsgroups_train.data = [re.sub(r'[\w\.-]+@[\w\.-]+', '', d) for d in newsgroups_train.data] # Remove email
newsgroups_train.data = [re.sub(r"\([^()]*\)", "", d) for d in newsgroups_train.data] # Remove names
newsgroups_train.data = [d.replace("From: ", "") for d in newsgroups_train.data] # Remove "From: "
newsgroups_train.data = [d.replace("\nSubject: ", "") for d in newsgroups_train.data] # Remove "\nSubject: "
# Put training points into a dataframe
df_train = pd.DataFrame(newsgroups_train.data, columns=['Text'])
df_train['Label'] = newsgroups_train.target
# Match label to target name index
df_train['Class Name'] = df_train['Label'].map(newsgroups_train.target_names.__getitem__)
# Retain text samples that can be used in the gecko model.
df_train = df_train[df_train['Text'].str.len() < 10000]

df_train
接下来,您将从训练数据集中获取 100 个数据点并丢弃一些类别来对部分数据进行采样,以便完成本教程中的操作。选择要比较的科学类别。
# Take a sample of each label category from df_train
SAMPLE_SIZE = 150
df_train = (df_train.groupby('Label', as_index = False)
                    .apply(lambda x: x.sample(SAMPLE_SIZE))
                    .reset_index(drop=True))

# Choose categories about science
df_train = df_train[df_train['Class Name'].str.contains('sci')]

# Reset the index
df_train = df_train.reset_index()
df_train
df_train['Class Name'].value_counts()
sci.crypt          150
sci.electronics    150
sci.med            150
sci.space          150
Name: Class Name, dtype: int64
创建嵌入
在本部分,您将了解如何使用 Gemini API 的嵌入为 DataFrame 中的不同文本生成嵌入。
对使用 Model embedding 的 Embedding 进行了 API 更改-001
对于新嵌入模型 embedding-001,有一个新的任务类型参数和可选标题(仅在与 task_type=RETRIEVAL_DOCUMENT 时有效)。
这些新参数仅适用于最新的嵌入模型。任务类型包括:
| 任务类型 | 说明 |
|---|---|
| RETRIEVAL_QUERY | 指定给定文本是搜索/检索设置中的查询。 |
| RETRIEVAL_DOCUMENT | 指定给定文本是搜索/检索设置中的文档。 |
| SEMANTIC_SIMILARITY | 指定给定文本用于语义文本相似度 (STS)。 |
| 分类 | 指定嵌入用于分类。 |
| 集群 | 指定嵌入用于聚类。 |
from tqdm.auto import tqdm
tqdm.pandas()

from google.api_core import retry

def make_embed_text_fn(model):

  @retry.Retry(timeout=300.0)
  def embed_fn(text: str) -> list[float]:
    # Set the task_type to CLUSTERING.
    embedding = genai.embed_content(model=model,
                                    content=text,
                                    task_type="clustering")
    return embedding["embedding"]

  return embed_fn

def create_embeddings(df):
  model = 'models/embedding-001'
  df['Embeddings'] = df['Text'].progress_apply(make_embed_text_fn(model))
  return df

df_train = create_embeddings(df_train)
0%| | 0/600 [00:00<?, ?it/s]
降维
文档嵌入向量的长度为 768。为了直观呈现嵌入的文档如何分组,您需要应用降维,因为您只能在 2D 或 3D 空间中可视化嵌入。上下文相似的文档在空间中应彼此靠近,而不是不太相似的文档。
len(df_train['Embeddings'][0])
768
# Convert df_train['Embeddings'] Pandas series to a np.array of float32
X = np.array(df_train['Embeddings'].to_list(), dtype=np.float32)
X.shape
(600, 768)
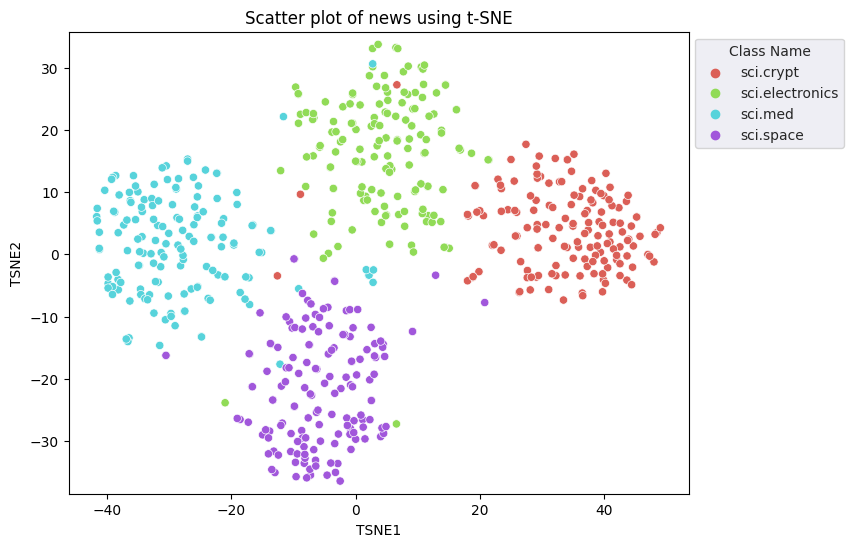
您将应用 t 分布式随机邻域嵌入 (t-SNE) 方法来进行降维。此方法减少了维度数量,同时保留聚类(彼此靠近的点紧密相连)。对于原始数据,模型会尝试构建其他数据点是“邻近点”(例如,它们具有相似含义)的分布。然后,它会优化目标函数,以在可视化结果中保持类似的分布。
tsne = TSNE(random_state=0, n_iter=1000)
tsne_results = tsne.fit_transform(X)
df_tsne = pd.DataFrame(tsne_results, columns=['TSNE1', 'TSNE2'])
df_tsne['Class Name'] = df_train['Class Name'] # Add labels column from df_train to df_tsne
df_tsne
fig, ax = plt.subplots(figsize=(8,6)) # Set figsize
sns.set_style('darkgrid', {"grid.color": ".6", "grid.linestyle": ":"})
sns.scatterplot(data=df_tsne, x='TSNE1', y='TSNE2', hue='Class Name', palette='hls')
sns.move_legend(ax, "upper left", bbox_to_anchor=(1, 1))
plt.title('Scatter plot of news using t-SNE');
plt.xlabel('TSNE1');
plt.ylabel('TSNE2');
plt.axis('equal')
(-46.191162300109866,
 53.521015357971194,
 -39.96646995544434,
 37.282975387573245)
将结果与 KMeans 进行比较
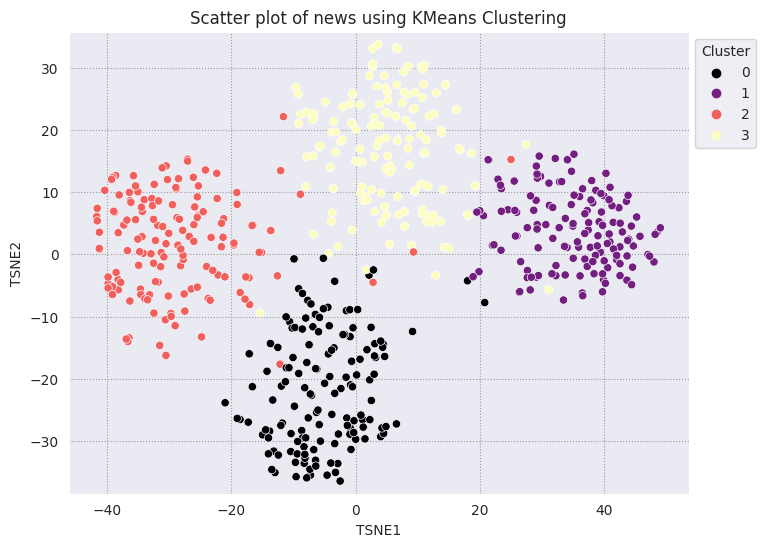
KMeans 聚类是一种流行的聚类算法,通常用于非监督式学习。它以迭代方式确定最佳的 k 个中心点,并将每个样本分配给最接近的形心。将嵌入直接输入 KMeans 算法,以便将嵌入的可视化与机器学习算法的性能进行比较。
# Apply KMeans
kmeans_model = KMeans(n_clusters=4, random_state=1, n_init='auto').fit(X)
labels = kmeans_model.fit_predict(X)
df_tsne['Cluster'] = labels
df_tsne
fig, ax = plt.subplots(figsize=(8,6)) # Set figsize
sns.set_style('darkgrid', {"grid.color": ".6", "grid.linestyle": ":"})
sns.scatterplot(data=df_tsne, x='TSNE1', y='TSNE2', hue='Cluster', palette='magma')
sns.move_legend(ax, "upper left", bbox_to_anchor=(1, 1))
plt.title('Scatter plot of news using KMeans Clustering');
plt.xlabel('TSNE1');
plt.ylabel('TSNE2');
plt.axis('equal')
(-46.191162300109866,
 53.521015357971194,
 -39.96646995544434,
 37.282975387573245)
def get_majority_cluster_per_group(df_tsne_cluster, class_names):
  class_clusters = dict()
  for c in class_names:
    # Get rows of dataframe that are equal to c
    rows = df_tsne_cluster.loc[df_tsne_cluster['Class Name'] == c]
    # Get majority value in Cluster column of the rows selected
    cluster = rows.Cluster.mode().values[0]
    # Populate mapping dictionary
    class_clusters[c] = cluster
  return class_clusters
classes = df_tsne['Class Name'].unique()
class_clusters = get_majority_cluster_per_group(df_tsne, classes)
class_clusters
{'sci.crypt': 1, 'sci.electronics': 3, 'sci.med': 2, 'sci.space': 0}
获取每个群组的大部分集群,并查看该集群中该群组的实际成员数量。
# Convert the Cluster column to use the class name
class_by_id = {v: k for k, v in class_clusters.items()}
df_tsne['Predicted'] = df_tsne['Cluster'].map(class_by_id.__getitem__)

# Filter to the correctly matched rows
correct = df_tsne[df_tsne['Class Name'] == df_tsne['Predicted']]

# Summarise, as a percentage
acc = correct['Class Name'].value_counts() / SAMPLE_SIZE
acc
sci.space          0.966667
sci.med            0.960000
sci.electronics    0.953333
sci.crypt          0.926667
Name: Class Name, dtype: float64
# Get predicted values by name
df_tsne['Predicted'] = ''
for idx, rows in df_tsne.iterrows():
  cluster = rows['Cluster']
  # Get key from mapping based on cluster value
  key = list(class_clusters.keys())[list(class_clusters.values()).index(cluster)]
  df_tsne.at[idx, 'Predicted'] = key

df_tsne
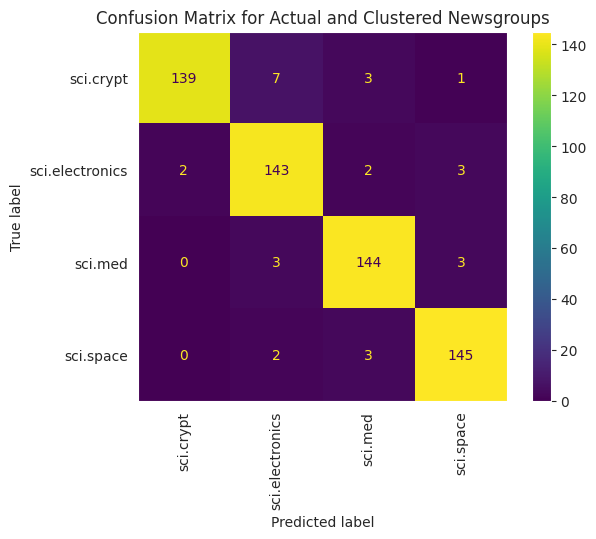
为了更好地直观呈现应用于数据的 KMeans 的性能,您可以使用混淆矩阵。通过混淆矩阵,您可以评估分类模型在准确率之外的性能。您可以查看被错误分类的积分会被归类为哪些商品。您需要您在上面的 DataFrame 中收集的实际值和预测值。
cm = confusion_matrix(df_tsne['Class Name'].to_list(), df_tsne['Predicted'].to_list())
disp = ConfusionMatrixDisplay(confusion_matrix=cm,
                              display_labels=classes)
disp.plot(xticks_rotation='vertical')
plt.title('Confusion Matrix for Actual and Clustered Newsgroups');
plt.grid(False)
后续步骤
现在,您已经使用聚类创建了自己的嵌入可视化内容!尝试使用您自己的文本数据,将其可视化为嵌入。您可以执行降维以完成可视化步骤。请注意,TSNE 擅长对输入进行聚类,但可能需要较长时间才能收敛,或者可能会卡在局部最小值。如果您遇到此问题,可以考虑另一种技术,即主成分分析 (PCA)。
除了 KMeans 之外,还有其他聚类算法,例如基于密度的空间聚类 (DBSCAN)。
如需了解如何在 Gemini API 中使用其他服务,请参阅 Python 快速入门。如需详细了解如何使用嵌入,请查看提供的示例。如需了解如何从头开始创建字词,请参阅 TensorFlow 的字词嵌入教程。