
|
|
|
 הצגת המקור ב-GitHub הצגת המקור ב-GitHub
|
סקירה
ב-notebook הזה תלמדו להשתמש בהטמעות ש-Gemini API יצר כדי לאמן מודל שיכול לסווג סוגים שונים של פוסטים בקבוצת דיון לפי נושא.
במדריך הזה תאמנו את המסווג לחזות לאיזו כיתה שייך פוסט בקבוצת דיון.
דרישות מוקדמות
אפשר להפעיל את המדריך למתחילים הזה ב-Google Colab.
כדי להשלים את המדריך למתחילים הזה בסביבת הפיתוח שלכם, צריך לוודא שהסביבה שלכם עומדת בדרישות הבאות:
- Python 3.9 ואילך
- התקנה של
jupyterכדי להריץ את ה-notebook.
הגדרה
קודם כול, מורידים ומתקינים את ספריית Python של Gemini API.
pip install -U -q google.generativeai
import re
import tqdm
import keras
import numpy as np
import pandas as pd

import google.generativeai as genai

# Used to securely store your API key
from google.colab import userdata

import seaborn as sns
import matplotlib.pyplot as plt

from keras import layers
from matplotlib.ticker import MaxNLocator
from sklearn.datasets import fetch_20newsgroups
import sklearn.metrics as skmetrics
קבלת מפתח API
כדי להשתמש ב-Gemini API, קודם צריך לקבל מפתח API. אם עדיין אין לכם מפתח, אתם יכולים ליצור מפתח בלחיצה אחת ב-Google AI Studio.
ב-Colab, מוסיפים את המפתח למנהל הסודות שמופיע מתחת לסמל 🔑 בחלונית השמאלית. נותנים למכשיר את השם API_KEY.
אחרי שמקבלים את מפתח ה-API, מעבירים אותו ל-SDK. תוכל לעשות זאת בשתי דרכים:
- מכניסים את המפתח למשתנה הסביבה
GOOGLE_API_KEY(ערכת ה-SDK תאסוף אותו משם באופן אוטומטי). - צריך להעביר את המפתח אל
genai.configure(api_key=...)
# Or use `os.getenv('API_KEY')` to fetch an environment variable.
API_KEY=userdata.get('API_KEY')

genai.configure(api_key=API_KEY)
for m in genai.list_models():
  if 'embedContent' in m.supported_generation_methods:
    print(m.name)
models/embedding-001
models/embedding-001
מערך נתונים
מערך נתוני הטקסט של 20 קבוצות חדשות מכיל 18,000 פוסטים של קבוצות חדשות ב-20 נושאים, המחולקים לערכות של אימון ובדיקה. החלוקה בין מערכי הנתונים לאימון ולמבחן מבוססת על הודעות שפורסמו לפני ואחרי תאריך מסוים. במדריך הזה נשתמש בקבוצות המשנה של מערכי הנתונים לאימון ולבדיקה. תעבדו מראש את הנתונים ותארגנו אותם ב-dataframes של Pandas.
newsgroups_train = fetch_20newsgroups(subset='train')
newsgroups_test = fetch_20newsgroups(subset='test')

# View list of class names for dataset
newsgroups_train.target_names
['alt.atheism',
 'comp.graphics',
 'comp.os.ms-windows.misc',
 'comp.sys.ibm.pc.hardware',
 'comp.sys.mac.hardware',
 'comp.windows.x',
 'misc.forsale',
 'rec.autos',
 'rec.motorcycles',
 'rec.sport.baseball',
 'rec.sport.hockey',
 'sci.crypt',
 'sci.electronics',
 'sci.med',
 'sci.space',
 'soc.religion.christian',
 'talk.politics.guns',
 'talk.politics.mideast',
 'talk.politics.misc',
 'talk.religion.misc']
הדוגמה הבאה מראה איך נראית נקודה על הגרף מתוך ערכת האימון.
idx = newsgroups_train.data[0].index('Lines')
print(newsgroups_train.data[0][idx:])
Lines: 15

 I was wondering if anyone out there could enlighten me on this car I saw
the other day. It was a 2-door sports car, looked to be from the late 60s/
early 70s. It was called a Bricklin. The doors were really small. In addition,
the front bumper was separate from the rest of the body. This is
all I know. If anyone can tellme a model name, engine specs, years
of production, where this car is made, history, or whatever info you
have on this funky looking car, please e-mail.

Thanks,

- IL
   ---- brought to you by your neighborhood Lerxst ----
עכשיו תתחילו לעבד מראש את הנתונים של המדריך הזה. עליך להסיר מידע רגיש כמו שמות, כתובות אימייל או חלקים מיותרים מהטקסט כמו "From: " ו-"\nSubject: ". יש לארגן את המידע במסגרת נתונים של Pandas כך שיהיה קריא יותר.
def preprocess_newsgroup_data(newsgroup_dataset):
  # Apply functions to remove names, emails, and extraneous words from data points in newsgroups.data
  newsgroup_dataset.data = [re.sub(r'[\w\.-]+@[\w\.-]+', '', d) for d in newsgroup_dataset.data] # Remove email
  newsgroup_dataset.data = [re.sub(r"\([^()]*\)", "", d) for d in newsgroup_dataset.data] # Remove names
  newsgroup_dataset.data = [d.replace("From: ", "") for d in newsgroup_dataset.data] # Remove "From: "
  newsgroup_dataset.data = [d.replace("\nSubject: ", "") for d in newsgroup_dataset.data] # Remove "\nSubject: "

  # Cut off each text entry after 5,000 characters
  newsgroup_dataset.data = [d[0:5000] if len(d) > 5000 else d for d in newsgroup_dataset.data]

  # Put data points into dataframe
  df_processed = pd.DataFrame(newsgroup_dataset.data, columns=['Text'])
  df_processed['Label'] = newsgroup_dataset.target
  # Match label to target name index
  df_processed['Class Name'] = ''
  for idx, row in df_processed.iterrows():
    df_processed.at[idx, 'Class Name'] = newsgroup_dataset.target_names[row['Label']]

  return df_processed
# Apply preprocessing function to training and test datasets
df_train = preprocess_newsgroup_data(newsgroups_train)
df_test = preprocess_newsgroup_data(newsgroups_test)

df_train.head()
בשלב הבא, תדגמו חלק מהנתונים על ידי איסוף של 100 נקודות נתונים במערך הנתונים לאימון, ושחרור של כמה מהקטגוריות שנלמדו במדריך הזה. בוחרים את הקטגוריות המדעיות להשוואה.
def sample_data(df, num_samples, classes_to_keep):
  df = df.groupby('Label', as_index = False).apply(lambda x: x.sample(num_samples)).reset_index(drop=True)

  df = df[df['Class Name'].str.contains(classes_to_keep)]

  # Reset the encoding of the labels after sampling and dropping certain categories
  df['Class Name'] = df['Class Name'].astype('category')
  df['Encoded Label'] = df['Class Name'].cat.codes

  return df
TRAIN_NUM_SAMPLES = 100
TEST_NUM_SAMPLES = 25
CLASSES_TO_KEEP = 'sci' # Class name should contain 'sci' in it to keep science categories
df_train = sample_data(df_train, TRAIN_NUM_SAMPLES, CLASSES_TO_KEEP)
df_test = sample_data(df_test, TEST_NUM_SAMPLES, CLASSES_TO_KEEP)
df_train.value_counts('Class Name')
Class Name
sci.crypt          100
sci.electronics    100
sci.med            100
sci.space          100
dtype: int64
df_test.value_counts('Class Name')
Class Name
sci.crypt          25
sci.electronics    25
sci.med            25
sci.space          25
dtype: int64
יצירת הטמעות
בקטע הזה נסביר איך ליצור הטמעות לקטע טקסט באמצעות הטמעות מ-Gemini API. למידע נוסף על הטמעות, אפשר לעיין במדריך להטמעה.
שינויים בממשק API של Embeddings-001
למודל ההטמעות החדש יש פרמטר חדש של סוג משימה והכותרת האופציונלית (רלוונטי רק ל-task_type=RETRIEVAL_DOCUMENT).
הפרמטרים החדשים האלה רלוונטיים רק למודלים החדשים ביותר של הטמעות.סוגי המשימות הם:
| סוג המשימה | תיאור |
|---|---|
| RETRIEVAL_QUERY | מציינת שהטקסט הנתון הוא שאילתה בהגדרת חיפוש/אחזור. |
| RETRIEVAL_DOCUMENT | מציינת שהטקסט הנתון הוא מסמך בהגדרת חיפוש/אחזור. |
| SEMANTIC_SIMILARITY | מציינת שהטקסט הנתון ישמש לדמיון סמנטי (STS). |
| סיווג | מציינת שההטמעות ישמשו לסיווג. |
| אשכול | מציינת שההטמעות ישמשו לקיבוץ לאשכולות. |
from tqdm.auto import tqdm
tqdm.pandas()

from google.api_core import retry

def make_embed_text_fn(model):

  @retry.Retry(timeout=300.0)
  def embed_fn(text: str) -> list[float]:
    # Set the task_type to CLASSIFICATION.
    embedding = genai.embed_content(model=model,
                                    content=text,
                                    task_type="classification")
    return embedding['embedding']

  return embed_fn

def create_embeddings(model, df):
  df['Embeddings'] = df['Text'].progress_apply(make_embed_text_fn(model))
  return df
model = 'models/embedding-001'
df_train = create_embeddings(model, df_train)
df_test = create_embeddings(model, df_test)
0%|          | 0/400 [00:00<?, ?it/s]
0%|          | 0/100 [00:00<?, ?it/s]
df_train.head()
פיתוח מודל סיווג פשוט
כאן תגדירו מודל פשוט עם שכבה מוסתרת אחת ופלט הסתברות של מחלקה אחת. החיזוי יתאים להסתברות שקטע טקסט יהיה סוג מסוים של חדשות. כשבונים את המודל, Keras ערבב באופן אוטומטי את הנקודות על הגרף.
def build_classification_model(input_size: int, num_classes: int) -> keras.Model:
  inputs = x = keras.Input(input_size)
  x = layers.Dense(input_size, activation='relu')(x)
  x = layers.Dense(num_classes, activation='sigmoid')(x)
  return keras.Model(inputs=[inputs], outputs=x)
# Derive the embedding size from the first training element.
embedding_size = len(df_train['Embeddings'].iloc[0])

# Give your model a different name, as you have already used the variable name 'model'
classifier = build_classification_model(embedding_size, len(df_train['Class Name'].unique()))
classifier.summary()

classifier.compile(loss = keras.losses.SparseCategoricalCrossentropy(from_logits=True),
                   optimizer = keras.optimizers.Adam(learning_rate=0.001),
                   metrics=['accuracy'])
Model: "model"
_________________________________________________________________
 Layer (type)                Output Shape              Param #
=================================================================
 input_1 (InputLayer)        [(None, 768)]             0

 dense (Dense)               (None, 768)               590592

 dense_1 (Dense)             (None, 4)                 3076

=================================================================
Total params: 593668 (2.26 MB)
Trainable params: 593668 (2.26 MB)
Non-trainable params: 0 (0.00 Byte)
_________________________________________________________________
embedding_size
768
לאמן את המודל כדי לסווג קבוצות חדשות
לבסוף, תוכלו לאמן מודל פשוט. כדאי להשתמש במספר קטן של תקופות של זמן מערכת כדי להימנע מהתאמה יתר. התקופה הראשונה נמשכת הרבה יותר זמן מהשאר, כי צריך לחשב את ההטמעות רק פעם אחת.
NUM_EPOCHS = 20
BATCH_SIZE = 32

# Split the x and y components of the train and validation subsets.
y_train = df_train['Encoded Label']
x_train = np.stack(df_train['Embeddings'])
y_val = df_test['Encoded Label']
x_val = np.stack(df_test['Embeddings'])

# Train the model for the desired number of epochs.
callback = keras.callbacks.EarlyStopping(monitor='accuracy', patience=3)

history = classifier.fit(x=x_train,
                         y=y_train,
                         validation_data=(x_val, y_val),
                         callbacks=[callback],
                         batch_size=BATCH_SIZE,
                         epochs=NUM_EPOCHS,)
Epoch 1/20
/usr/local/lib/python3.10/dist-packages/keras/src/backend.py:5729: UserWarning: "`sparse_categorical_crossentropy` received `from_logits=True`, but the `output` argument was produced by a Softmax activation and thus does not represent logits. Was this intended?
  output, from_logits = _get_logits(
13/13 [==============================] - 1s 30ms/step - loss: 1.2141 - accuracy: 0.6675 - val_loss: 0.9801 - val_accuracy: 0.8800
Epoch 2/20
13/13 [==============================] - 0s 12ms/step - loss: 0.7580 - accuracy: 0.9400 - val_loss: 0.6061 - val_accuracy: 0.9300
Epoch 3/20
13/13 [==============================] - 0s 13ms/step - loss: 0.4249 - accuracy: 0.9525 - val_loss: 0.3902 - val_accuracy: 0.9200
Epoch 4/20
13/13 [==============================] - 0s 13ms/step - loss: 0.2561 - accuracy: 0.9625 - val_loss: 0.2597 - val_accuracy: 0.9400
Epoch 5/20
13/13 [==============================] - 0s 13ms/step - loss: 0.1693 - accuracy: 0.9700 - val_loss: 0.2145 - val_accuracy: 0.9300
Epoch 6/20
13/13 [==============================] - 0s 13ms/step - loss: 0.1240 - accuracy: 0.9850 - val_loss: 0.1801 - val_accuracy: 0.9600
Epoch 7/20
13/13 [==============================] - 0s 21ms/step - loss: 0.0931 - accuracy: 0.9875 - val_loss: 0.1623 - val_accuracy: 0.9400
Epoch 8/20
13/13 [==============================] - 0s 16ms/step - loss: 0.0736 - accuracy: 0.9925 - val_loss: 0.1418 - val_accuracy: 0.9600
Epoch 9/20
13/13 [==============================] - 0s 20ms/step - loss: 0.0613 - accuracy: 0.9925 - val_loss: 0.1315 - val_accuracy: 0.9700
Epoch 10/20
13/13 [==============================] - 0s 20ms/step - loss: 0.0479 - accuracy: 0.9975 - val_loss: 0.1235 - val_accuracy: 0.9600
Epoch 11/20
13/13 [==============================] - 0s 19ms/step - loss: 0.0399 - accuracy: 0.9975 - val_loss: 0.1219 - val_accuracy: 0.9700
Epoch 12/20
13/13 [==============================] - 0s 21ms/step - loss: 0.0326 - accuracy: 0.9975 - val_loss: 0.1158 - val_accuracy: 0.9700
Epoch 13/20
13/13 [==============================] - 0s 19ms/step - loss: 0.0263 - accuracy: 1.0000 - val_loss: 0.1127 - val_accuracy: 0.9700
Epoch 14/20
13/13 [==============================] - 0s 17ms/step - loss: 0.0229 - accuracy: 1.0000 - val_loss: 0.1123 - val_accuracy: 0.9700
Epoch 15/20
13/13 [==============================] - 0s 20ms/step - loss: 0.0195 - accuracy: 1.0000 - val_loss: 0.1063 - val_accuracy: 0.9700
Epoch 16/20
13/13 [==============================] - 0s 17ms/step - loss: 0.0172 - accuracy: 1.0000 - val_loss: 0.1070 - val_accuracy: 0.9700
הערכת ביצועי המודל
משתמשים ב-Keras Model.evaluate כדי לקבל את רמת ההפסד והדיוק במערך הנתונים לבדיקה.
classifier.evaluate(x=x_val, y=y_val, return_dict=True)
4/4 [==============================] - 0s 4ms/step - loss: 0.1070 - accuracy: 0.9700
{'loss': 0.10700511932373047, 'accuracy': 0.9700000286102295}
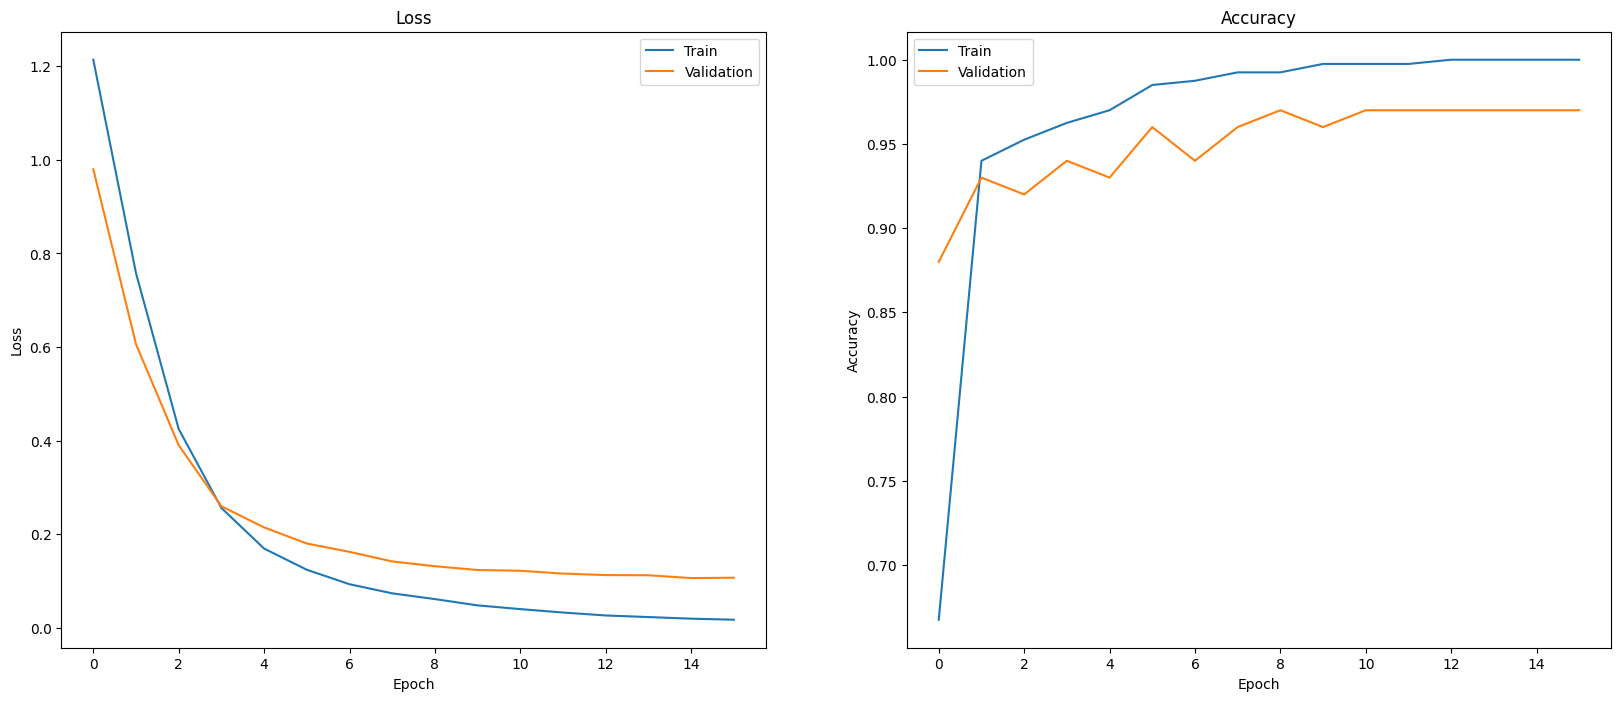
אחת הדרכים להעריך את ביצועי המודל שלכם היא להציג באופן חזותי את ביצועי המסווג. השתמשו ב-plot_history כדי לראות את מגמות אובדן והדיוק במהלך התקופות של זמן המערכת.
def plot_history(history):
  """
    Plotting training and validation learning curves.

    Args:
      history: model history with all the metric measures
  """
  fig, (ax1, ax2) = plt.subplots(1,2)
  fig.set_size_inches(20, 8)

  # Plot loss
  ax1.set_title('Loss')
  ax1.plot(history.history['loss'], label = 'train')
  ax1.plot(history.history['val_loss'], label = 'test')
  ax1.set_ylabel('Loss')

  ax1.set_xlabel('Epoch')
  ax1.legend(['Train', 'Validation'])

  # Plot accuracy
  ax2.set_title('Accuracy')
  ax2.plot(history.history['accuracy'],  label = 'train')
  ax2.plot(history.history['val_accuracy'], label = 'test')
  ax2.set_ylabel('Accuracy')
  ax2.set_xlabel('Epoch')
  ax2.legend(['Train', 'Validation'])

  plt.show()

plot_history(history)
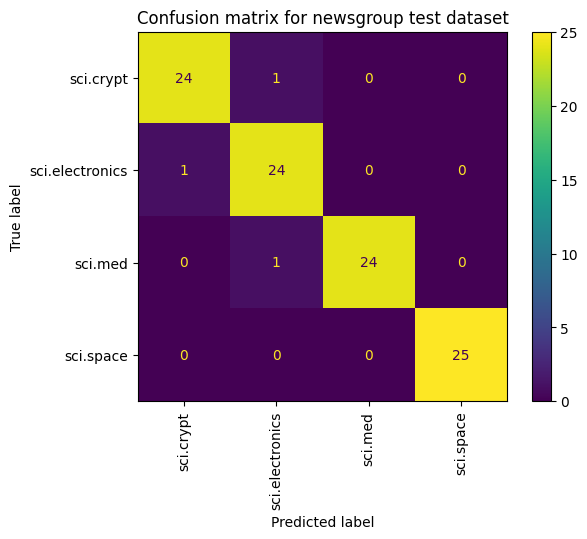
דרך נוספת לצפות בביצועי המודל, מעבר למדידה של אובדן ודיוק, היא להשתמש במטריצת בלבול. מטריצת הבלבול מאפשרת להעריך את הביצועים של מודל הסיווג מעבר לרמת הדיוק. אתם יכולים לראות לאילו נקודות שסווגו באופן שגוי. כדי לבנות את מטריצת הבלבול לבעיה הזו של סיווג מרובה מחלקות, קבל את הערכים בפועל בערכת הבדיקה ואת הערכים החזויים.
כדי להתחיל, יוצרים את המחלקה החזויה לכל דוגמה בקבוצת האימות באמצעות Model.predict().
y_hat = classifier.predict(x=x_val)
y_hat = np.argmax(y_hat, axis=1)
4/4 [==============================] - 0s 4ms/step
labels_dict = dict(zip(df_test['Class Name'], df_test['Encoded Label']))
labels_dict
{'sci.crypt': 0, 'sci.electronics': 1, 'sci.med': 2, 'sci.space': 3}
cm = skmetrics.confusion_matrix(y_val, y_hat)
disp = skmetrics.ConfusionMatrixDisplay(confusion_matrix=cm,
                              display_labels=labels_dict.keys())
disp.plot(xticks_rotation='vertical')
plt.title('Confusion matrix for newsgroup test dataset');
plt.grid(False)
השלבים הבאים
למידע נוסף על שימוש בהטמעות, כדאי לעיין במדריכים הבאים: