L'AI SDK di Vercel è una potente libreria open source per creare applicazioni, interfacce utente e agenti basati sull'AI in TypeScript.
Questa guida ti illustrerà la creazione di un'applicazione Node.js con TypeScript che utilizza l'AI SDK per connettersi all'API Gemini tramite il provider Google AI generativa ed eseguire l'analisi automatizzata delle tendenze di mercato. L'applicazione finale:
- Utilizzare Gemini con la Ricerca Google per studiare le tendenze di mercato attuali.
- Estrai dati strutturati dalla ricerca per generare grafici.
- Combina la ricerca e i grafici in un report HTML professionale e salvalo come PDF.
Prerequisiti
Per completare questa guida, ti serviranno:
- Una chiave API Gemini. Puoi crearne uno senza costi in Google AI Studio.
- Node.js versione 18 o successive.
- Un gestore di pacchetti, ad esempio
npm,pnpmoyarn.
Configura l'applicazione
Innanzitutto, crea una nuova directory per il progetto e inizializzala.
npm
mkdir market-trend-appcd market-trend-appnpm init -y
pnpm
mkdir market-trend-appcd market-trend-apppnpm init
filo
mkdir market-trend-appcd market-trend-appyarn init -y
Installa le dipendenze
Poi, installa l'SDK AI, il provider Google AI generativa e altre dipendenze necessarie.
npm
npm install ai @ai-sdk/google zodnpm install -D @types/node tsx typescript && npx tsc --init
Per evitare un errore del compilatore TypeScript, commenta la seguente riga nel file tsconfig.json generato:
//"verbatimModuleSyntax": true,
pnpm
pnpm add ai @ai-sdk/google zodpnpm add -D @types/node tsx typescript
filo
yarn add ai @ai-sdk/google zodyarn add -D @types/node tsx typescript && yarn tsc --init
Per evitare un errore del compilatore TypeScript, commenta la seguente riga nel file tsconfig.json generato:
//"verbatimModuleSyntax": true,
Questa applicazione utilizzerà anche i pacchetti di terze parti Puppeteer e Chart.js per il rendering dei grafici e la creazione di un PDF:
npm
npm install puppeteer chart.jsnpm install -D @types/chart.js
pnpm
pnpm add puppeteer chart.jspnpm add -D @types/chart.js
filo
yarn add puppeteer chart.jsyarn add -D @types/chart.js
Il pacchetto puppeteer richiede l'esecuzione di uno script per scaricare il browser Chromium. Il gestore dei pacchetti potrebbe richiedere l'approvazione, quindi assicurati di approvare lo
script quando richiesto.
Configura la chiave API
Imposta la variabile di ambiente GOOGLE_GENERATIVE_AI_API_KEY con la chiave API Gemini. Il fornitore di Google AI generativa cerca automaticamente la chiave API in
questa variabile di ambiente.
macOS/Linux
export GOOGLE_GENERATIVE_AI_API_KEY="YOUR_API_KEY_HERE"Powershell
setx GOOGLE_GENERATIVE_AI_API_KEY "YOUR_API_KEY_HERE"Crea la tua applicazione
Ora creiamo il file principale per la nostra applicazione. Crea un nuovo file denominato
main.ts nella directory del progetto. Creerai la logica in questo file
passo dopo passo.
Per un test rapido per assicurarti che tutto sia configurato correttamente, aggiungi il seguente
codice a main.ts. Questo esempio di base utilizza generateText per ottenere una risposta semplice da Gemini.
import { google } from "@ai-sdk/google";
import { generateText } from "ai";

async function main() {
  const { text } = await generateText({
    model: google("gemini-3.5-flash"),
    prompt: 'What is plant-based milk?',
  });

  console.log(text);
}

main().catch(console.error);
Prima di aggiungere ulteriore complessità, esegui questo script per verificare che l'ambiente sia configurato correttamente. Esegui questo comando nel terminale:
npm
npx tsc && node main.jspnpm
pnpm tsx main.tsfilo
yarn tsc && node main.jsSe tutto è configurato correttamente, vedrai la risposta di Gemini stampata nella console.
Eseguire ricerche di mercato con la Ricerca Google
Per ottenere informazioni aggiornate, puoi attivare lo strumento Ricerca Google per Gemini. Quando questo strumento è attivo, il modello può cercare sul web per rispondere al prompt e restituirà le fonti che ha utilizzato.
Sostituisci i contenuti di main.ts con il seguente codice per eseguire il primo
passaggio della nostra analisi.
import { google } from "@ai-sdk/google";
import { generateText } from "ai";

async function main() {
  // Step 1: Search market trends
  const { text: marketTrends, sources } = await generateText({
    model: google("gemini-3.5-flash"),
    tools: {
      google_search: google.tools.googleSearch({}),
    },
    prompt: `Search the web for market trends for plant-based milk in North America for 2024-2025.
          I need to know the market size, key players and their market share, and primary consumer drivers.
          `,
  });

  console.log("Market trends found:\n", marketTrends);
  // To see the sources, uncomment the following line:
  // console.log("Sources:\n", sources);
}

main().catch(console.error);
Estrarre i dati del grafico
A questo punto, elaboriamo il testo della ricerca per estrarre dati strutturati adatti ai grafici. Utilizza la funzione generateObject dell'AI SDK insieme a uno schema zod
per definire la struttura esatta dei dati.
Crea anche una funzione helper per convertire questi dati strutturati in una
configurazione che Chart.js possa comprendere.
Aggiungi il seguente codice a main.ts. Prendi nota dei nuovi import e del passaggio 2 aggiunto.
import { google } from "@ai-sdk/google";
import { generateText, generateObject } from "ai";
import { z } from "zod/v4";
import { ChartConfiguration } from "chart.js";

// Helper function to create Chart.js configurations
function createChartConfig({labels, data, label, type, colors,}: {
  labels: string[];
  data: number[];
  label: string;
  type: "bar" | "line";
  colors: string[];
}): ChartConfiguration {
  return {
    type: type,
    data: {
      labels: labels,
      datasets: [
        {
          label: label,
          data: data,
          borderWidth: 1,
          ...(type === "bar" && { backgroundColor: colors }),
          ...(type === "line" && colors.length > 0 && { borderColor: colors[0] }),
        },
      ],
    },
    options: {
      animation: { duration: 0 }, // Disable animations for static PDF rendering
    },
  };
}

async function main() {
  // Step 1: Search market trends
  const { text: marketTrends, sources } = await generateText({
    model: google("gemini-3.5-flash"),
    tools: {
      google_search: google.tools.googleSearch({}),
    },
    prompt: `Search the web for market trends for plant-based milk in North America for 2024-2025.
          I need to know the market size, key players and their market share, and primary consumer drivers.
          `,
  });

  console.log("Market trends found.");

  // Step 2: Extract chart data
  const { object: chartData } = await generateObject({
    model: google("gemini-3.5-flash"),
    schema: z.object({
      chartConfigurations: z
        .array(
          z.object({
            type: z.enum(["bar", "line"]).describe('The type of chart to generate. Either "bar" or "line"',),
            labels: z.array(z.string()).describe("A list of chart labels"),
            data: z.array(z.number()).describe("A list of the chart data"),
            label: z.string().describe("A label for the chart"),
            colors: z.array(z.string()).describe('A list of colors to use for the chart, e.g. "rgba(255, 99, 132, 0.8)"',),
          }),
        )
        .describe("A list of chart configurations"),
    }),
    prompt: `Given the following market trends text, come up with a list of 1-3 meaningful bar or line charts
    and generate chart data.

Market Trends:
${marketTrends}
`,
  });

  const chartConfigs = chartData.chartConfigurations.map(createChartConfig);

  console.log("Chart configurations generated.");
}

main().catch(console.error);
Generare il report finale
Nell'ultimo passaggio, chiedi a Gemini di agire come un esperto nella stesura di report. Fornisci la ricerca di mercato, le configurazioni del grafico e una serie chiara di istruzioni per creare un report HTML. Quindi, utilizza Puppeteer per eseguire il rendering di questo HTML e salvarlo come PDF.
Aggiungi l'importazione finale di puppeteer e il "Passaggio 3" al file main.ts.
// ... (imports from previous step)
import puppeteer from "puppeteer";

// ... (createChartConfig helper function from previous step)

async function main() {
  // ... (Step 1 and 2 from previous step)

  // Step 3: Generate the final HTML report and save it as a PDF
  const { text: htmlReport } = await generateText({
    model: google("gemini-3.5-flash"),
    prompt: `You are an expert financial analyst and report writer.
    Your task is to generate a comprehensive market analysis report in HTML format.

    **Instructions:**
    1.  Write a full HTML document.
    2.  Use the provided "Market Trends" text to write the main body of the report. Structure it with clear headings and paragraphs.
    3.  Incorporate the provided "Chart Configurations" to visualize the data. For each chart, you MUST create a unique <canvas> element and a corresponding <script> block to render it using Chart.js.
    4.  Reference the "Sources" at the end of the report.
    5.  Do not include any placeholder data; use only the information provided.
    6.  Return only the raw HTML code.

    **Chart Rendering Snippet:**
    Include this script in the head of the HTML: <script src="https://cdn.jsdelivr.net/npm/chart.js"></script>
    For each chart, use a structure like below, ensuring the canvas 'id' is unique for each chart, and apply the correspinding config:

    ---
    <div style="width: 800px; height: 600px;">
      <canvas id="chart1"></canvas>
    </div>
    <script>
      new Chart(document.getElementById('chart1'), config);
    </script>
    ---
    (For the second chart, use 'chart2' and the corresponding config, and so on.)

    **Data:**
    - Market Trends: ${marketTrends}
    - Chart Configurations: ${JSON.stringify(chartConfigs)}
    - Sources: ${JSON.stringify(sources)}
    `,
  });

  // LLMs may wrap the HTML in a markdown code block, so strip it.
  const finalHtml = htmlReport.replace(/^```html\n/, "").replace(/\n```$/, "");

  const browser = await puppeteer.launch();
  const page = await browser.newPage();
  await page.setContent(finalHtml);
  await page.pdf({ path: "report.pdf", format: "A4" });
  await browser.close();

  console.log("\nReport generated successfully: report.pdf");
}

main().catch(console.error);
Esegui l'applicazione
Ora puoi eseguire l'applicazione. Esegui questo comando nel terminale:
npm
npx tsc && node main.jspnpm
pnpm tsx main.tsfilo
yarn tsc && node main.jsVedrai la registrazione nel terminale man mano che lo script esegue ogni passaggio.
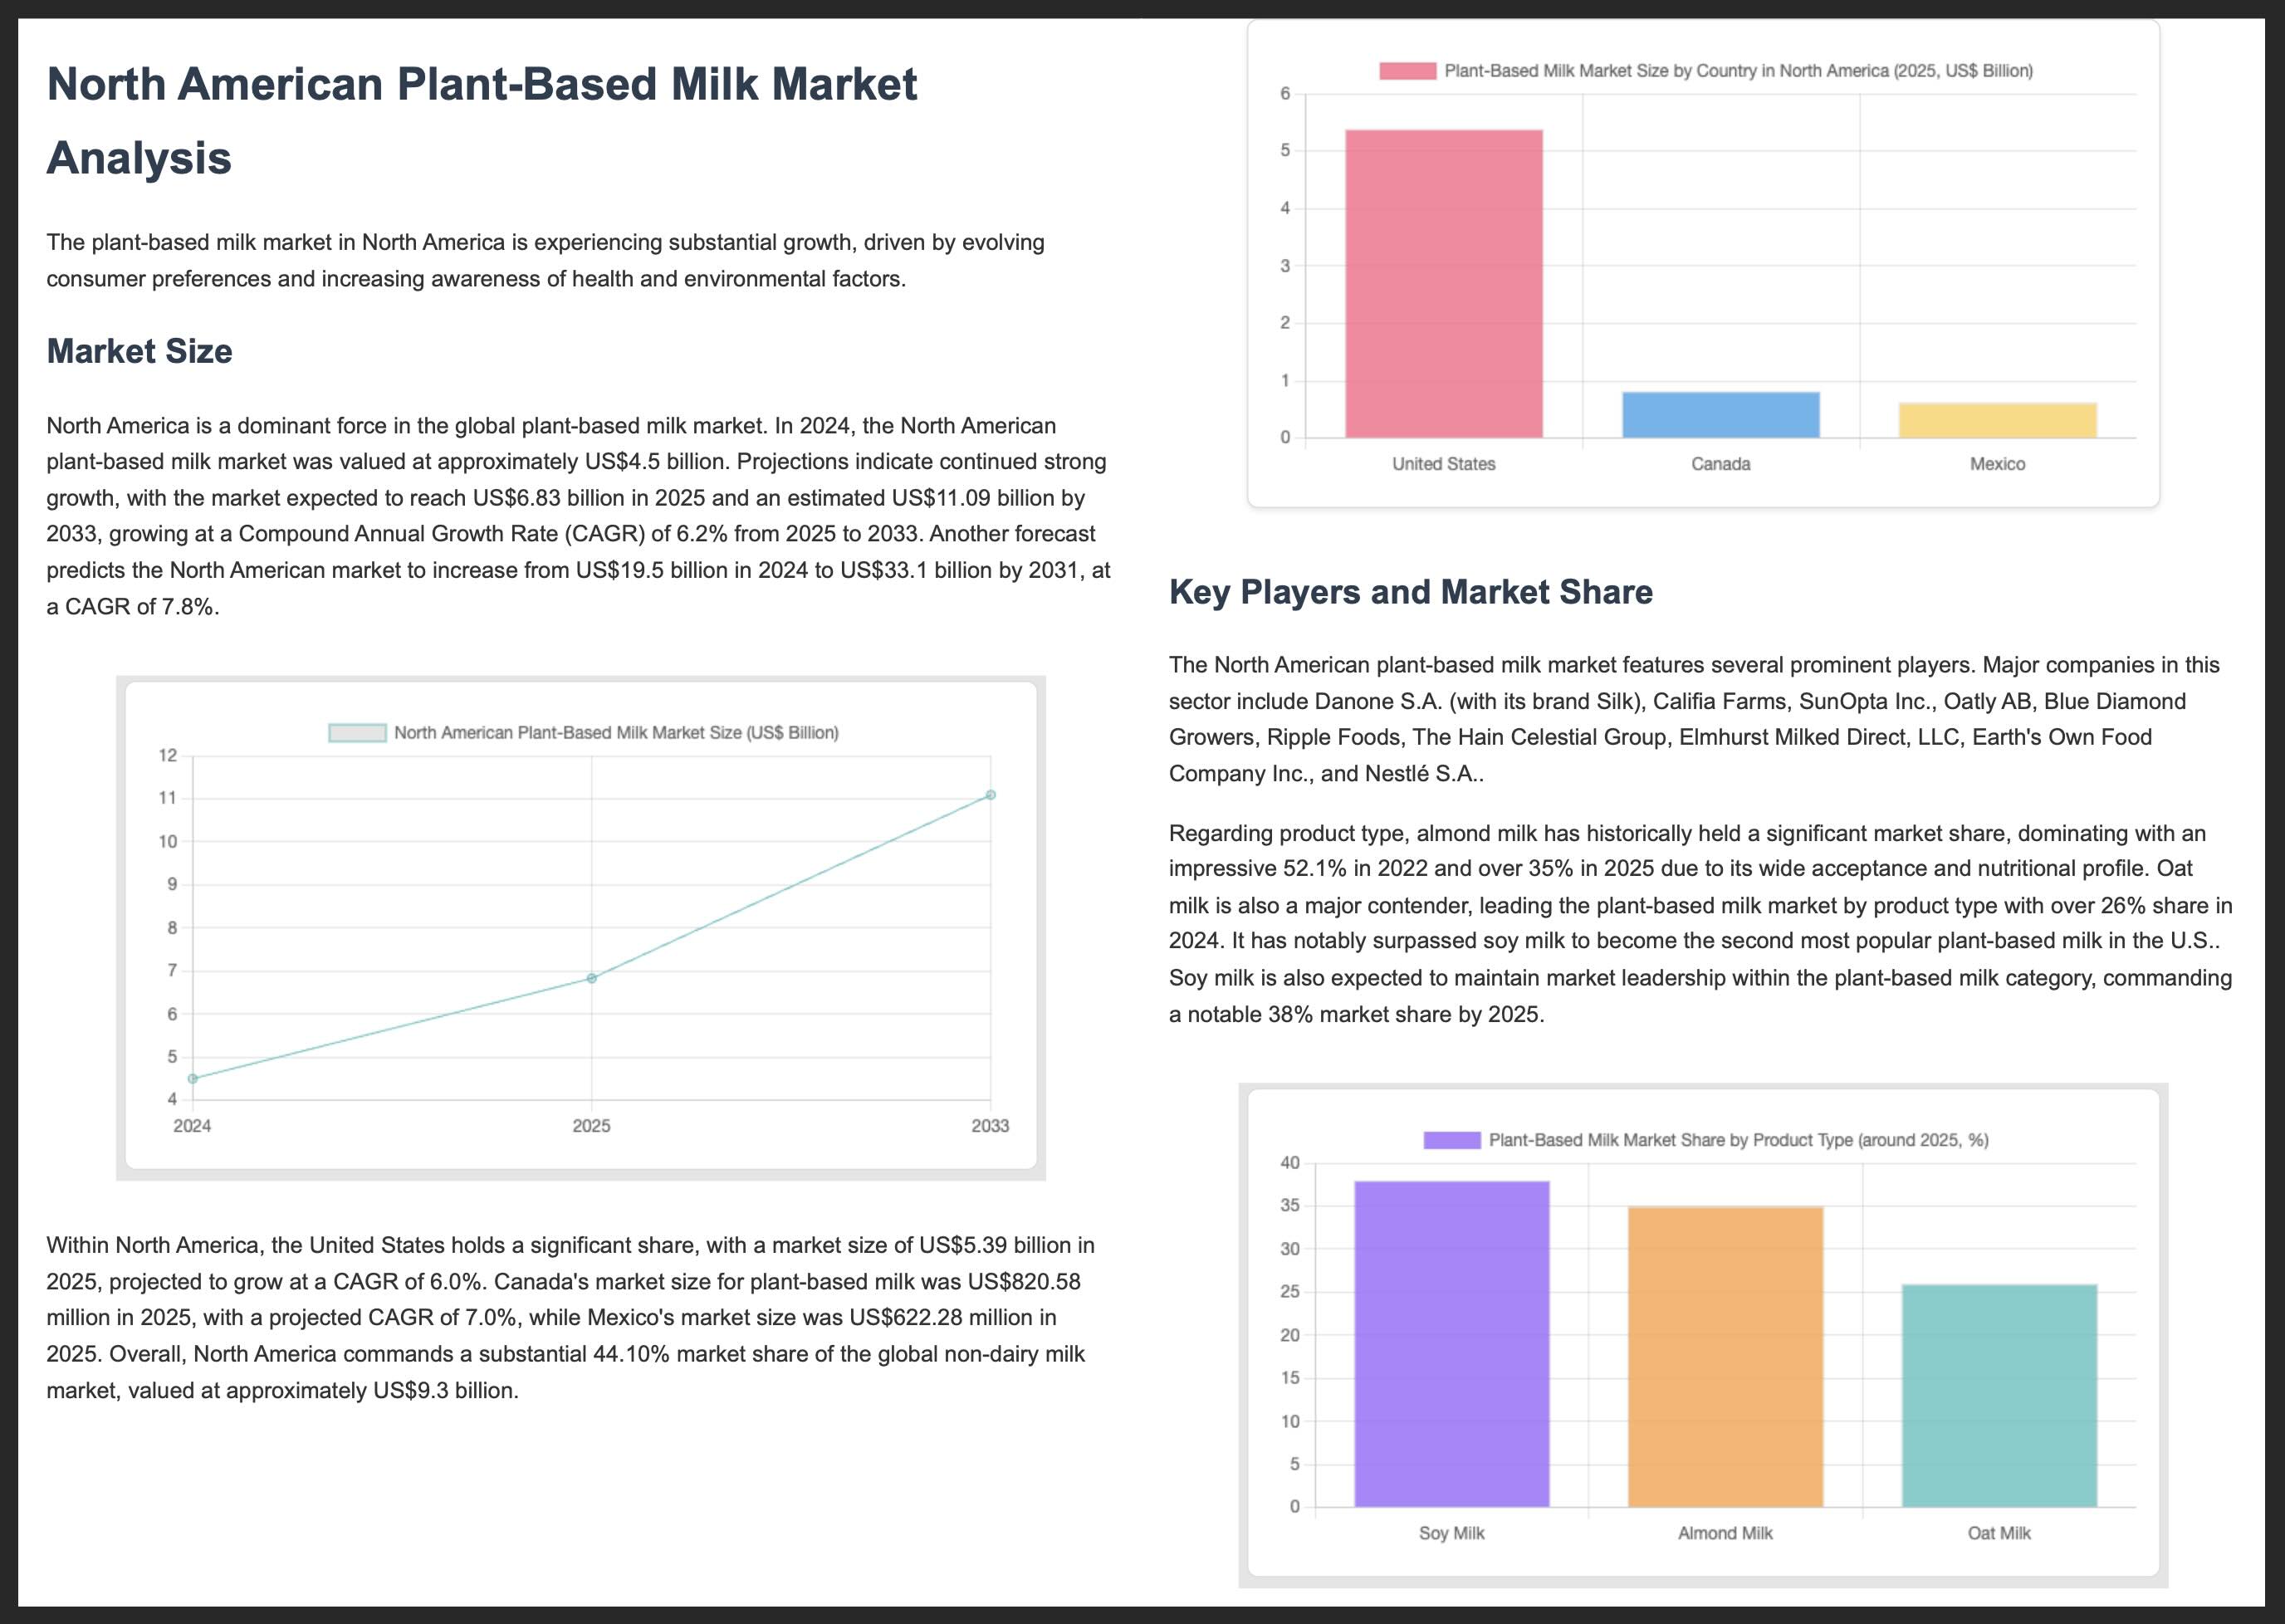
Al termine, nella directory del progetto verrà creato un file report.pdf contenente l'analisi di mercato.
Di seguito sono riportate le prime due pagine di un report PDF di esempio:
Ulteriori risorse
Per saperne di più sulla creazione con Gemini e l'AI SDK, esplora queste risorse: