Vercel의 AI SDK는 TypeScript에서 AI 기반 애플리케이션, 사용자 인터페이스, 에이전트를 빌드하기 위한 강력한 오픈소스 라이브러리입니다.
이 가이드에서는 AI SDK를 사용하여 Google 생성형 AI 제공업체를 통해 Gemini API에 연결하고 자동화된 시장 동향 분석을 실행하는 TypeScript로 Node.js 애플리케이션을 빌드하는 방법을 안내합니다. 최종 애플리케이션은 다음을 수행합니다.
- Google 검색과 함께 Gemini를 사용하여 현재 시장 동향을 조사하세요.
- 조사에서 구조화된 데이터를 추출하여 차트를 생성합니다.
- 연구 결과와 차트를 전문적인 HTML 보고서로 결합하고 PDF로 저장합니다.
기본 요건
이 가이드를 완료하려면 다음이 필요합니다.
- Gemini API 키 Google AI Studio에서 무료로 만들 수 있습니다.
- Node.js 버전 18 이상
npm,pnpm,yarn와 같은 패키지 관리자
애플리케이션 설정
먼저 프로젝트의 새 디렉터리를 만들고 초기화합니다.
npm
mkdir market-trend-appcd market-trend-appnpm init -y
pnpm
mkdir market-trend-appcd market-trend-apppnpm init
털실
mkdir market-trend-appcd market-trend-appyarn init -y
종속 항목 설치
그런 다음 AI SDK, Google 생성형 AI 제공자, 기타 필요한 종속 항목을 설치합니다.
npm
npm install ai @ai-sdk/google zodnpm install -D @types/node tsx typescript && npx tsc --init
TypeScript 컴파일러 오류를 방지하려면 생성된 tsconfig.json에서 다음 줄을 주석 처리하세요.
//"verbatimModuleSyntax": true,
pnpm
pnpm add ai @ai-sdk/google zodpnpm add -D @types/node tsx typescript
털실
yarn add ai @ai-sdk/google zodyarn add -D @types/node tsx typescript && yarn tsc --init
TypeScript 컴파일러 오류를 방지하려면 생성된 tsconfig.json에서 다음 줄을 주석 처리하세요.
//"verbatimModuleSyntax": true,
이 애플리케이션은 차트를 렌더링하고 PDF를 만들기 위해 서드 파티 패키지 Puppeteer와 Chart.js도 사용합니다.
npm
npm install puppeteer chart.jsnpm install -D @types/chart.js
pnpm
pnpm add puppeteer chart.jspnpm add -D @types/chart.js
털실
yarn add puppeteer chart.jsyarn add -D @types/chart.js
puppeteer 패키지를 사용하려면 스크립트를 실행하여 Chromium 브라우저를 다운로드해야 합니다. 패키지 관리자에서 승인을 요청할 수 있으므로 메시지가 표시되면 스크립트를 승인해야 합니다.
API 키 구성
GOOGLE_GENERATIVE_AI_API_KEY 환경 변수를 Gemini API 키로 설정합니다. Google 생성형 AI 제공자는 이 환경 변수에서 API 키를 자동으로 찾습니다.
MacOS/Linux
export GOOGLE_GENERATIVE_AI_API_KEY="YOUR_API_KEY_HERE"Powershell
setx GOOGLE_GENERATIVE_AI_API_KEY "YOUR_API_KEY_HERE"자체 애플리케이션 구축
이제 애플리케이션의 기본 파일을 만들어 보겠습니다. 프로젝트 디렉터리에 main.ts라는 새 파일을 만듭니다. 이 파일에서 로직을 단계별로 빌드합니다.
모든 항목이 올바르게 설정되었는지 빠르게 테스트하려면 main.ts에 다음 코드를 추가하세요. 이 기본 예에서는 generateText을 사용하여 Gemini로부터 간단한 대답을 가져옵니다.
import { google } from "@ai-sdk/google";
import { generateText } from "ai";

async function main() {
  const { text } = await generateText({
    model: google("gemini-3.5-flash"),
    prompt: 'What is plant-based milk?',
  });

  console.log(text);
}

main().catch(console.error);
더 복잡한 작업을 추가하기 전에 이 스크립트를 실행하여 환경이 올바르게 구성되었는지 확인하세요. 터미널에서 다음 명령어를 실행합니다.
npm
npx tsc && node main.jspnpm
pnpm tsx main.ts털실
yarn tsc && node main.js모든 항목이 올바르게 설정되면 Gemini의 대답이 콘솔에 출력됩니다.
Google 검색으로 시장 조사하기
최신 정보를 얻으려면 Gemini의 Google 검색 도구를 사용 설정하세요. 이 도구가 활성화되면 모델이 웹을 검색하여 프롬프트에 답변하고 사용한 소스를 반환합니다.
main.ts의 콘텐츠를 다음 코드로 바꿔 분석의 첫 번째 단계를 실행합니다.
import { google } from "@ai-sdk/google";
import { generateText } from "ai";

async function main() {
  // Step 1: Search market trends
  const { text: marketTrends, sources } = await generateText({
    model: google("gemini-3.5-flash"),
    tools: {
      google_search: google.tools.googleSearch({}),
    },
    prompt: `Search the web for market trends for plant-based milk in North America for 2024-2025.
          I need to know the market size, key players and their market share, and primary consumer drivers.
          `,
  });

  console.log("Market trends found:\n", marketTrends);
  // To see the sources, uncomment the following line:
  // console.log("Sources:\n", sources);
}

main().catch(console.error);
차트 데이터 추출
다음으로 연구 텍스트를 처리하여 차트에 적합한 구조화된 데이터를 추출해 보겠습니다. AI SDK의 generateObject 함수를 zod 스키마와 함께 사용하여 정확한 데이터 구조를 정의합니다.
또한 이 구조화된 데이터를 Chart.js가 이해할 수 있는 구성으로 변환하는 도우미 함수를 만듭니다.
다음 코드를 main.ts에 추가합니다. 새 가져오기와 추가된 '2단계'를 참고하세요.
import { google } from "@ai-sdk/google";
import { generateText, generateObject } from "ai";
import { z } from "zod/v4";
import { ChartConfiguration } from "chart.js";

// Helper function to create Chart.js configurations
function createChartConfig({labels, data, label, type, colors,}: {
  labels: string[];
  data: number[];
  label: string;
  type: "bar" | "line";
  colors: string[];
}): ChartConfiguration {
  return {
    type: type,
    data: {
      labels: labels,
      datasets: [
        {
          label: label,
          data: data,
          borderWidth: 1,
          ...(type === "bar" && { backgroundColor: colors }),
          ...(type === "line" && colors.length > 0 && { borderColor: colors[0] }),
        },
      ],
    },
    options: {
      animation: { duration: 0 }, // Disable animations for static PDF rendering
    },
  };
}

async function main() {
  // Step 1: Search market trends
  const { text: marketTrends, sources } = await generateText({
    model: google("gemini-3.5-flash"),
    tools: {
      google_search: google.tools.googleSearch({}),
    },
    prompt: `Search the web for market trends for plant-based milk in North America for 2024-2025.
          I need to know the market size, key players and their market share, and primary consumer drivers.
          `,
  });

  console.log("Market trends found.");

  // Step 2: Extract chart data
  const { object: chartData } = await generateObject({
    model: google("gemini-3.5-flash"),
    schema: z.object({
      chartConfigurations: z
        .array(
          z.object({
            type: z.enum(["bar", "line"]).describe('The type of chart to generate. Either "bar" or "line"',),
            labels: z.array(z.string()).describe("A list of chart labels"),
            data: z.array(z.number()).describe("A list of the chart data"),
            label: z.string().describe("A label for the chart"),
            colors: z.array(z.string()).describe('A list of colors to use for the chart, e.g. "rgba(255, 99, 132, 0.8)"',),
          }),
        )
        .describe("A list of chart configurations"),
    }),
    prompt: `Given the following market trends text, come up with a list of 1-3 meaningful bar or line charts
    and generate chart data.

Market Trends:
${marketTrends}
`,
  });

  const chartConfigs = chartData.chartConfigurations.map(createChartConfig);

  console.log("Chart configurations generated.");
}

main().catch(console.error);
최종 보고서 생성
마지막 단계에서는 Gemini가 전문가 보고서 작성자 역할을 하도록 지시합니다. 시장 조사, 차트 구성, HTML 보고서 빌드를 위한 명확한 지침을 제공합니다. 그런 다음 Puppeteer를 사용하여 이 HTML을 렌더링하고 PDF로 저장합니다.
최종 puppeteer 가져오기 및 'Step 3'을 main.ts 파일에 추가합니다.
// ... (imports from previous step)
import puppeteer from "puppeteer";

// ... (createChartConfig helper function from previous step)

async function main() {
  // ... (Step 1 and 2 from previous step)

  // Step 3: Generate the final HTML report and save it as a PDF
  const { text: htmlReport } = await generateText({
    model: google("gemini-3.5-flash"),
    prompt: `You are an expert financial analyst and report writer.
    Your task is to generate a comprehensive market analysis report in HTML format.

    **Instructions:**
    1.  Write a full HTML document.
    2.  Use the provided "Market Trends" text to write the main body of the report. Structure it with clear headings and paragraphs.
    3.  Incorporate the provided "Chart Configurations" to visualize the data. For each chart, you MUST create a unique <canvas> element and a corresponding <script> block to render it using Chart.js.
    4.  Reference the "Sources" at the end of the report.
    5.  Do not include any placeholder data; use only the information provided.
    6.  Return only the raw HTML code.

    **Chart Rendering Snippet:**
    Include this script in the head of the HTML: <script src="https://cdn.jsdelivr.net/npm/chart.js"></script>
    For each chart, use a structure like below, ensuring the canvas 'id' is unique for each chart, and apply the correspinding config:

    ---
    <div style="width: 800px; height: 600px;">
      <canvas id="chart1"></canvas>
    </div>
    <script>
      new Chart(document.getElementById('chart1'), config);
    </script>
    ---
    (For the second chart, use 'chart2' and the corresponding config, and so on.)

    **Data:**
    - Market Trends: ${marketTrends}
    - Chart Configurations: ${JSON.stringify(chartConfigs)}
    - Sources: ${JSON.stringify(sources)}
    `,
  });

  // LLMs may wrap the HTML in a markdown code block, so strip it.
  const finalHtml = htmlReport.replace(/^```html\n/, "").replace(/\n```$/, "");

  const browser = await puppeteer.launch();
  const page = await browser.newPage();
  await page.setContent(finalHtml);
  await page.pdf({ path: "report.pdf", format: "A4" });
  await browser.close();

  console.log("\nReport generated successfully: report.pdf");
}

main().catch(console.error);
애플리케이션 실행
이제 애플리케이션을 실행할 수 있습니다. 터미널에서 다음 명령어를 실행합니다.
npm
npx tsc && node main.jspnpm
pnpm tsx main.ts털실
yarn tsc && node main.js스크립트가 각 단계를 실행하면 터미널에 로깅이 표시됩니다.
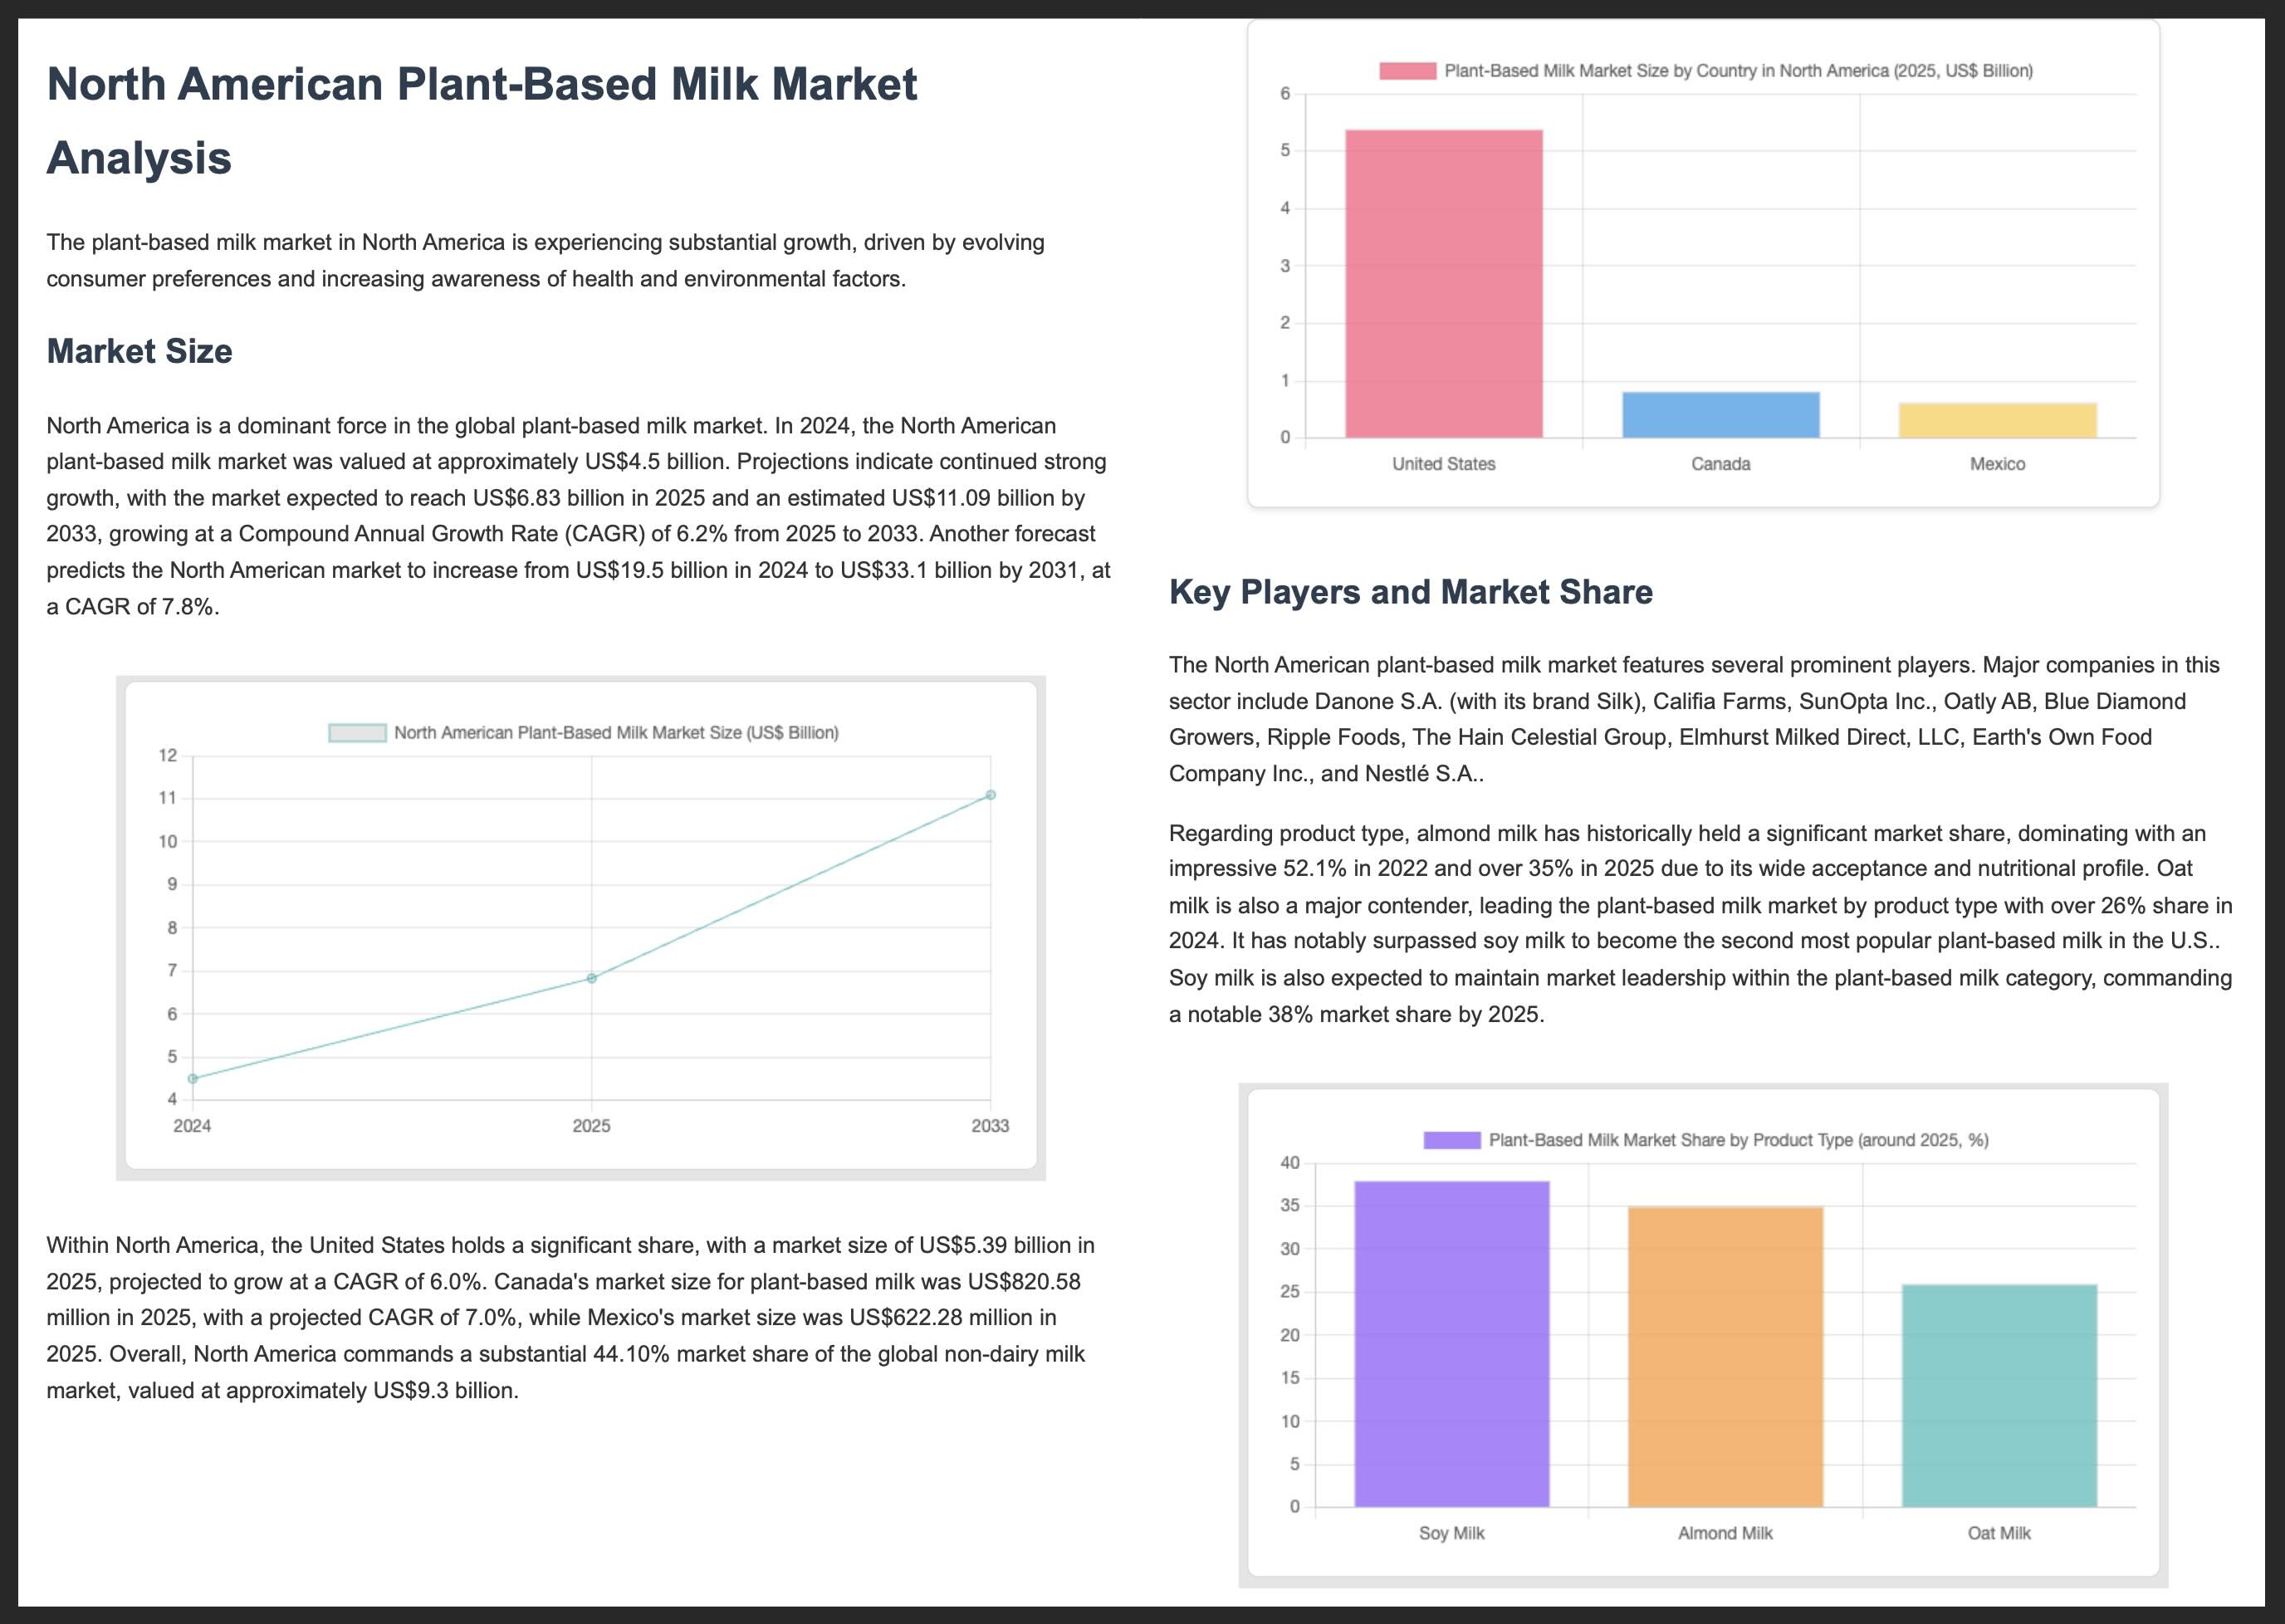
완료되면 시장 분석이 포함된 report.pdf 파일이 프로젝트 디렉터리에 생성됩니다.
아래는 PDF 보고서의 처음 두 페이지의 예입니다.
추가 자료
Gemini 및 AI SDK로 빌드하는 방법에 관한 자세한 내용은 다음 리소스를 참고하세요.