AI SDK ของ Vercel เป็นไลบรารีโอเพนซอร์สที่มีประสิทธิภาพสำหรับ การสร้างแอปพลิเคชัน อินเทอร์เฟซผู้ใช้ และเอเจนต์ที่ขับเคลื่อนด้วย AI ใน TypeScript
คู่มือนี้จะแนะนำคุณในการสร้างแอปพลิเคชัน Node.js ด้วย TypeScript ที่ใช้ AI SDK เพื่อเชื่อมต่อกับ Gemini API ผ่านผู้ให้บริการ Generative AI ของ Google และทำการวิเคราะห์เทรนด์ตลาดโดยอัตโนมัติ แอปพลิเคชันสุดท้ายจะมีลักษณะดังนี้
- ใช้ Gemini กับ Google Search เพื่อค้นคว้าวิจัยเทรนด์ตลาดปัจจุบัน
- แยก Structured Data จากการวิจัยเพื่อสร้างแผนภูมิ
- รวมการวิจัยและแผนภูมิไว้ในรายงาน HTML ระดับมืออาชีพ แล้วบันทึกเป็น PDF
ข้อกำหนดเบื้องต้น
คุณต้องมีสิ่งต่อไปนี้จึงจะทำตามคู่มือนี้ได้
- คีย์ Gemini API คุณสร้างคีย์ได้ฟรีใน Google AI Studio
- Node.js เวอร์ชัน 18 ขึ้นไป
- เครื่องมือจัดการแพ็กเกจ เช่น
npm,pnpm, หรือyarn
ตั้งค่าแอปพลิเคชัน
ขั้นแรก ให้สร้างไดเรกทอรีใหม่สำหรับโปรเจ็กต์แล้วเริ่มต้นไดเรกทอรี
npm
mkdir market-trend-appcd market-trend-appnpm init -y
pnpm
mkdir market-trend-appcd market-trend-apppnpm init
yarn
mkdir market-trend-appcd market-trend-appyarn init -y
ติดตั้งการอ้างอิง
จากนั้นติดตั้ง AI SDK, ผู้ให้บริการ Generative AI ของ Google และการอ้างอิงอื่นๆ ที่จำเป็น
npm
npm install ai @ai-sdk/google zodnpm install -D @types/node tsx typescript && npx tsc --init
ให้ใส่ความคิดเห็นในบรรทัดต่อไปนี้ใน tsconfig.json ที่สร้างขึ้นเพื่อป้องกันข้อผิดพลาดของคอมไพเลอร์ TypeScript
//"verbatimModuleSyntax": true,
pnpm
pnpm add ai @ai-sdk/google zodpnpm add -D @types/node tsx typescript
yarn
yarn add ai @ai-sdk/google zodyarn add -D @types/node tsx typescript && yarn tsc --init
ให้ใส่ความคิดเห็นในบรรทัดต่อไปนี้ใน tsconfig.json ที่สร้างขึ้นเพื่อป้องกันข้อผิดพลาดของคอมไพเลอร์ TypeScript
//"verbatimModuleSyntax": true,
แอปพลิเคชันนี้จะใช้แพ็กเกจของบุคคลที่สามอย่าง Puppeteer และ Chart.js สำหรับการแสดงแผนภูมิและการสร้าง PDF ด้วย
npm
npm install puppeteer chart.jsnpm install -D @types/chart.js
pnpm
pnpm add puppeteer chart.jspnpm add -D @types/chart.js
yarn
yarn add puppeteer chart.jsyarn add -D @types/chart.js
แพ็กเกจ puppeteer ต้องใช้สคริปต์เพื่อดาวน์โหลดเบราว์เซอร์ Chromium เครื่องมือจัดการแพ็กเกจอาจขออนุมัติ ดังนั้นโปรดอนุมัติสคริปต์เมื่อได้รับข้อความแจ้ง
กำหนดค่าคีย์ API
ตั้งค่าตัวแปรสภาพแวดล้อม GOOGLE_GENERATIVE_AI_API_KEY ด้วยคีย์ Gemini API ผู้ให้บริการ Generative AI ของ Google จะค้นหาคีย์ API ในตัวแปรสภาพแวดล้อมนี้โดยอัตโนมัติ
MacOS/Linux
export GOOGLE_GENERATIVE_AI_API_KEY="YOUR_API_KEY_HERE"Powershell
setx GOOGLE_GENERATIVE_AI_API_KEY "YOUR_API_KEY_HERE"สร้างแอปพลิเคชัน
ตอนนี้เรามาสร้างไฟล์หลักสำหรับแอปพลิเคชันกัน สร้างไฟล์ใหม่ชื่อ main.ts ในไดเรกทอรีโปรเจ็กต์ คุณจะสร้างตรรกะในไฟล์นี้ทีละขั้นตอน
หากต้องการทดสอบอย่างรวดเร็วเพื่อให้แน่ใจว่าตั้งค่าทุกอย่างถูกต้องแล้ว ให้เพิ่มโค้ดต่อไปนี้ลงใน main.ts ตัวอย่างพื้นฐานนี้ใช้ generateText เพื่อรับการตอบกลับอย่างง่ายจาก Gemini
import { google } from "@ai-sdk/google";
import { generateText } from "ai";

async function main() {
  const { text } = await generateText({
    model: google("gemini-3.5-flash"),
    prompt: 'What is plant-based milk?',
  });

  console.log(text);
}

main().catch(console.error);
ก่อนเพิ่มความซับซ้อน ให้เรียกใช้สคริปต์นี้เพื่อตรวจสอบว่าสภาพแวดล้อมของคุณได้รับการกำหนดค่าอย่างถูกต้อง เรียกใช้คำสั่งต่อไปนี้ในเทอร์มินัล
npm
npx tsc && node main.jspnpm
pnpm tsx main.tsyarn
yarn tsc && node main.jsหากตั้งค่าทุกอย่างถูกต้อง คุณจะเห็นการตอบกลับของ Gemini พิมพ์ลงในคอนโซล
ทำการวิจัยตลาดด้วย Google Search
หากต้องการรับข้อมูลล่าสุด คุณสามารถเปิดใช้เครื่องมือ Google Search สำหรับ Gemini ได้ เมื่อเครื่องมือนี้ทำงานอยู่ โมเดลจะค้นหาเว็บเพื่อตอบคำสั่งและแสดงแหล่งข้อมูลที่ใช้
แทนที่เนื้อหาของ main.ts ด้วยโค้ดต่อไปนี้เพื่อทำการวิเคราะห์ขั้นตอนแรก
import { google } from "@ai-sdk/google";
import { generateText } from "ai";

async function main() {
  // Step 1: Search market trends
  const { text: marketTrends, sources } = await generateText({
    model: google("gemini-3.5-flash"),
    tools: {
      google_search: google.tools.googleSearch({}),
    },
    prompt: `Search the web for market trends for plant-based milk in North America for 2024-2025.
          I need to know the market size, key players and their market share, and primary consumer drivers.
          `,
  });

  console.log("Market trends found:\n", marketTrends);
  // To see the sources, uncomment the following line:
  // console.log("Sources:\n", sources);
}

main().catch(console.error);
แยกข้อมูลแผนภูมิ
จากนั้นมาประมวลผลข้อความการวิจัยเพื่อแยก Structured Data ที่เหมาะสำหรับแผนภูมิ ใช้ฟังก์ชัน generateObject ของ AI SDK พร้อมกับสคีมา zod เพื่อกำหนดโครงสร้างข้อมูลที่แน่นอน
นอกจากนี้ ให้สร้างฟังก์ชันตัวช่วยเพื่อแปลง Structured Data นี้ให้เป็นการกำหนดค่าที่ Chart.js เข้าใจได้
เพิ่มโค้ดต่อไปนี้ลงใน main.ts โปรดสังเกตการนำเข้าใหม่และ "ขั้นตอนที่ 2" ที่เพิ่มเข้ามา
import { google } from "@ai-sdk/google";
import { generateText, generateObject } from "ai";
import { z } from "zod/v4";
import { ChartConfiguration } from "chart.js";

// Helper function to create Chart.js configurations
function createChartConfig({labels, data, label, type, colors,}: {
  labels: string[];
  data: number[];
  label: string;
  type: "bar" | "line";
  colors: string[];
}): ChartConfiguration {
  return {
    type: type,
    data: {
      labels: labels,
      datasets: [
        {
          label: label,
          data: data,
          borderWidth: 1,
          ...(type === "bar" && { backgroundColor: colors }),
          ...(type === "line" && colors.length > 0 && { borderColor: colors[0] }),
        },
      ],
    },
    options: {
      animation: { duration: 0 }, // Disable animations for static PDF rendering
    },
  };
}

async function main() {
  // Step 1: Search market trends
  const { text: marketTrends, sources } = await generateText({
    model: google("gemini-3.5-flash"),
    tools: {
      google_search: google.tools.googleSearch({}),
    },
    prompt: `Search the web for market trends for plant-based milk in North America for 2024-2025.
          I need to know the market size, key players and their market share, and primary consumer drivers.
          `,
  });

  console.log("Market trends found.");

  // Step 2: Extract chart data
  const { object: chartData } = await generateObject({
    model: google("gemini-3.5-flash"),
    schema: z.object({
      chartConfigurations: z
        .array(
          z.object({
            type: z.enum(["bar", "line"]).describe('The type of chart to generate. Either "bar" or "line"',),
            labels: z.array(z.string()).describe("A list of chart labels"),
            data: z.array(z.number()).describe("A list of the chart data"),
            label: z.string().describe("A label for the chart"),
            colors: z.array(z.string()).describe('A list of colors to use for the chart, e.g. "rgba(255, 99, 132, 0.8)"',),
          }),
        )
        .describe("A list of chart configurations"),
    }),
    prompt: `Given the following market trends text, come up with a list of 1-3 meaningful bar or line charts
    and generate chart data.

Market Trends:
${marketTrends}
`,
  });

  const chartConfigs = chartData.chartConfigurations.map(createChartConfig);

  console.log("Chart configurations generated.");
}

main().catch(console.error);
สร้างรายงานขั้นสุดท้าย
ในขั้นตอนสุดท้าย ให้สั่งให้ Gemini ทำหน้าที่เป็นผู้เขียนรายงานผู้เชี่ยวชาญ ระบุการวิจัยตลาด การกำหนดค่าแผนภูมิ และชุดคำแนะนำที่ชัดเจนสำหรับการสร้างรายงาน HTML จากนั้นใช้ Puppeteer เพื่อแสดง HTML นี้และบันทึกเป็น PDF
เพิ่มการนำเข้า puppeteer ขั้นสุดท้ายและ "ขั้นตอนที่ 3" ลงในไฟล์ main.ts
// ... (imports from previous step)
import puppeteer from "puppeteer";

// ... (createChartConfig helper function from previous step)

async function main() {
  // ... (Step 1 and 2 from previous step)

  // Step 3: Generate the final HTML report and save it as a PDF
  const { text: htmlReport } = await generateText({
    model: google("gemini-3.5-flash"),
    prompt: `You are an expert financial analyst and report writer.
    Your task is to generate a comprehensive market analysis report in HTML format.

    **Instructions:**
    1.  Write a full HTML document.
    2.  Use the provided "Market Trends" text to write the main body of the report. Structure it with clear headings and paragraphs.
    3.  Incorporate the provided "Chart Configurations" to visualize the data. For each chart, you MUST create a unique <canvas> element and a corresponding <script> block to render it using Chart.js.
    4.  Reference the "Sources" at the end of the report.
    5.  Do not include any placeholder data; use only the information provided.
    6.  Return only the raw HTML code.

    **Chart Rendering Snippet:**
    Include this script in the head of the HTML: <script src="https://cdn.jsdelivr.net/npm/chart.js"></script>
    For each chart, use a structure like below, ensuring the canvas 'id' is unique for each chart, and apply the correspinding config:

    ---
    <div style="width: 800px; height: 600px;">
      <canvas id="chart1"></canvas>
    </div>
    <script>
      new Chart(document.getElementById('chart1'), config);
    </script>
    ---
    (For the second chart, use 'chart2' and the corresponding config, and so on.)

    **Data:**
    - Market Trends: ${marketTrends}
    - Chart Configurations: ${JSON.stringify(chartConfigs)}
    - Sources: ${JSON.stringify(sources)}
    `,
  });

  // LLMs may wrap the HTML in a markdown code block, so strip it.
  const finalHtml = htmlReport.replace(/^```html\n/, "").replace(/\n```$/, "");

  const browser = await puppeteer.launch();
  const page = await browser.newPage();
  await page.setContent(finalHtml);
  await page.pdf({ path: "report.pdf", format: "A4" });
  await browser.close();

  console.log("\nReport generated successfully: report.pdf");
}

main().catch(console.error);
เรียกใช้แอปพลิเคชัน
ตอนนี้คุณพร้อมที่จะเรียกใช้แอปพลิเคชันแล้ว เรียกใช้คำสั่งต่อไปนี้ในเทอร์มินัล
npm
npx tsc && node main.jspnpm
pnpm tsx main.tsyarn
yarn tsc && node main.jsคุณจะเห็นการบันทึกในเทอร์มินัลเมื่อสคริปต์ดำเนินการแต่ละขั้นตอน
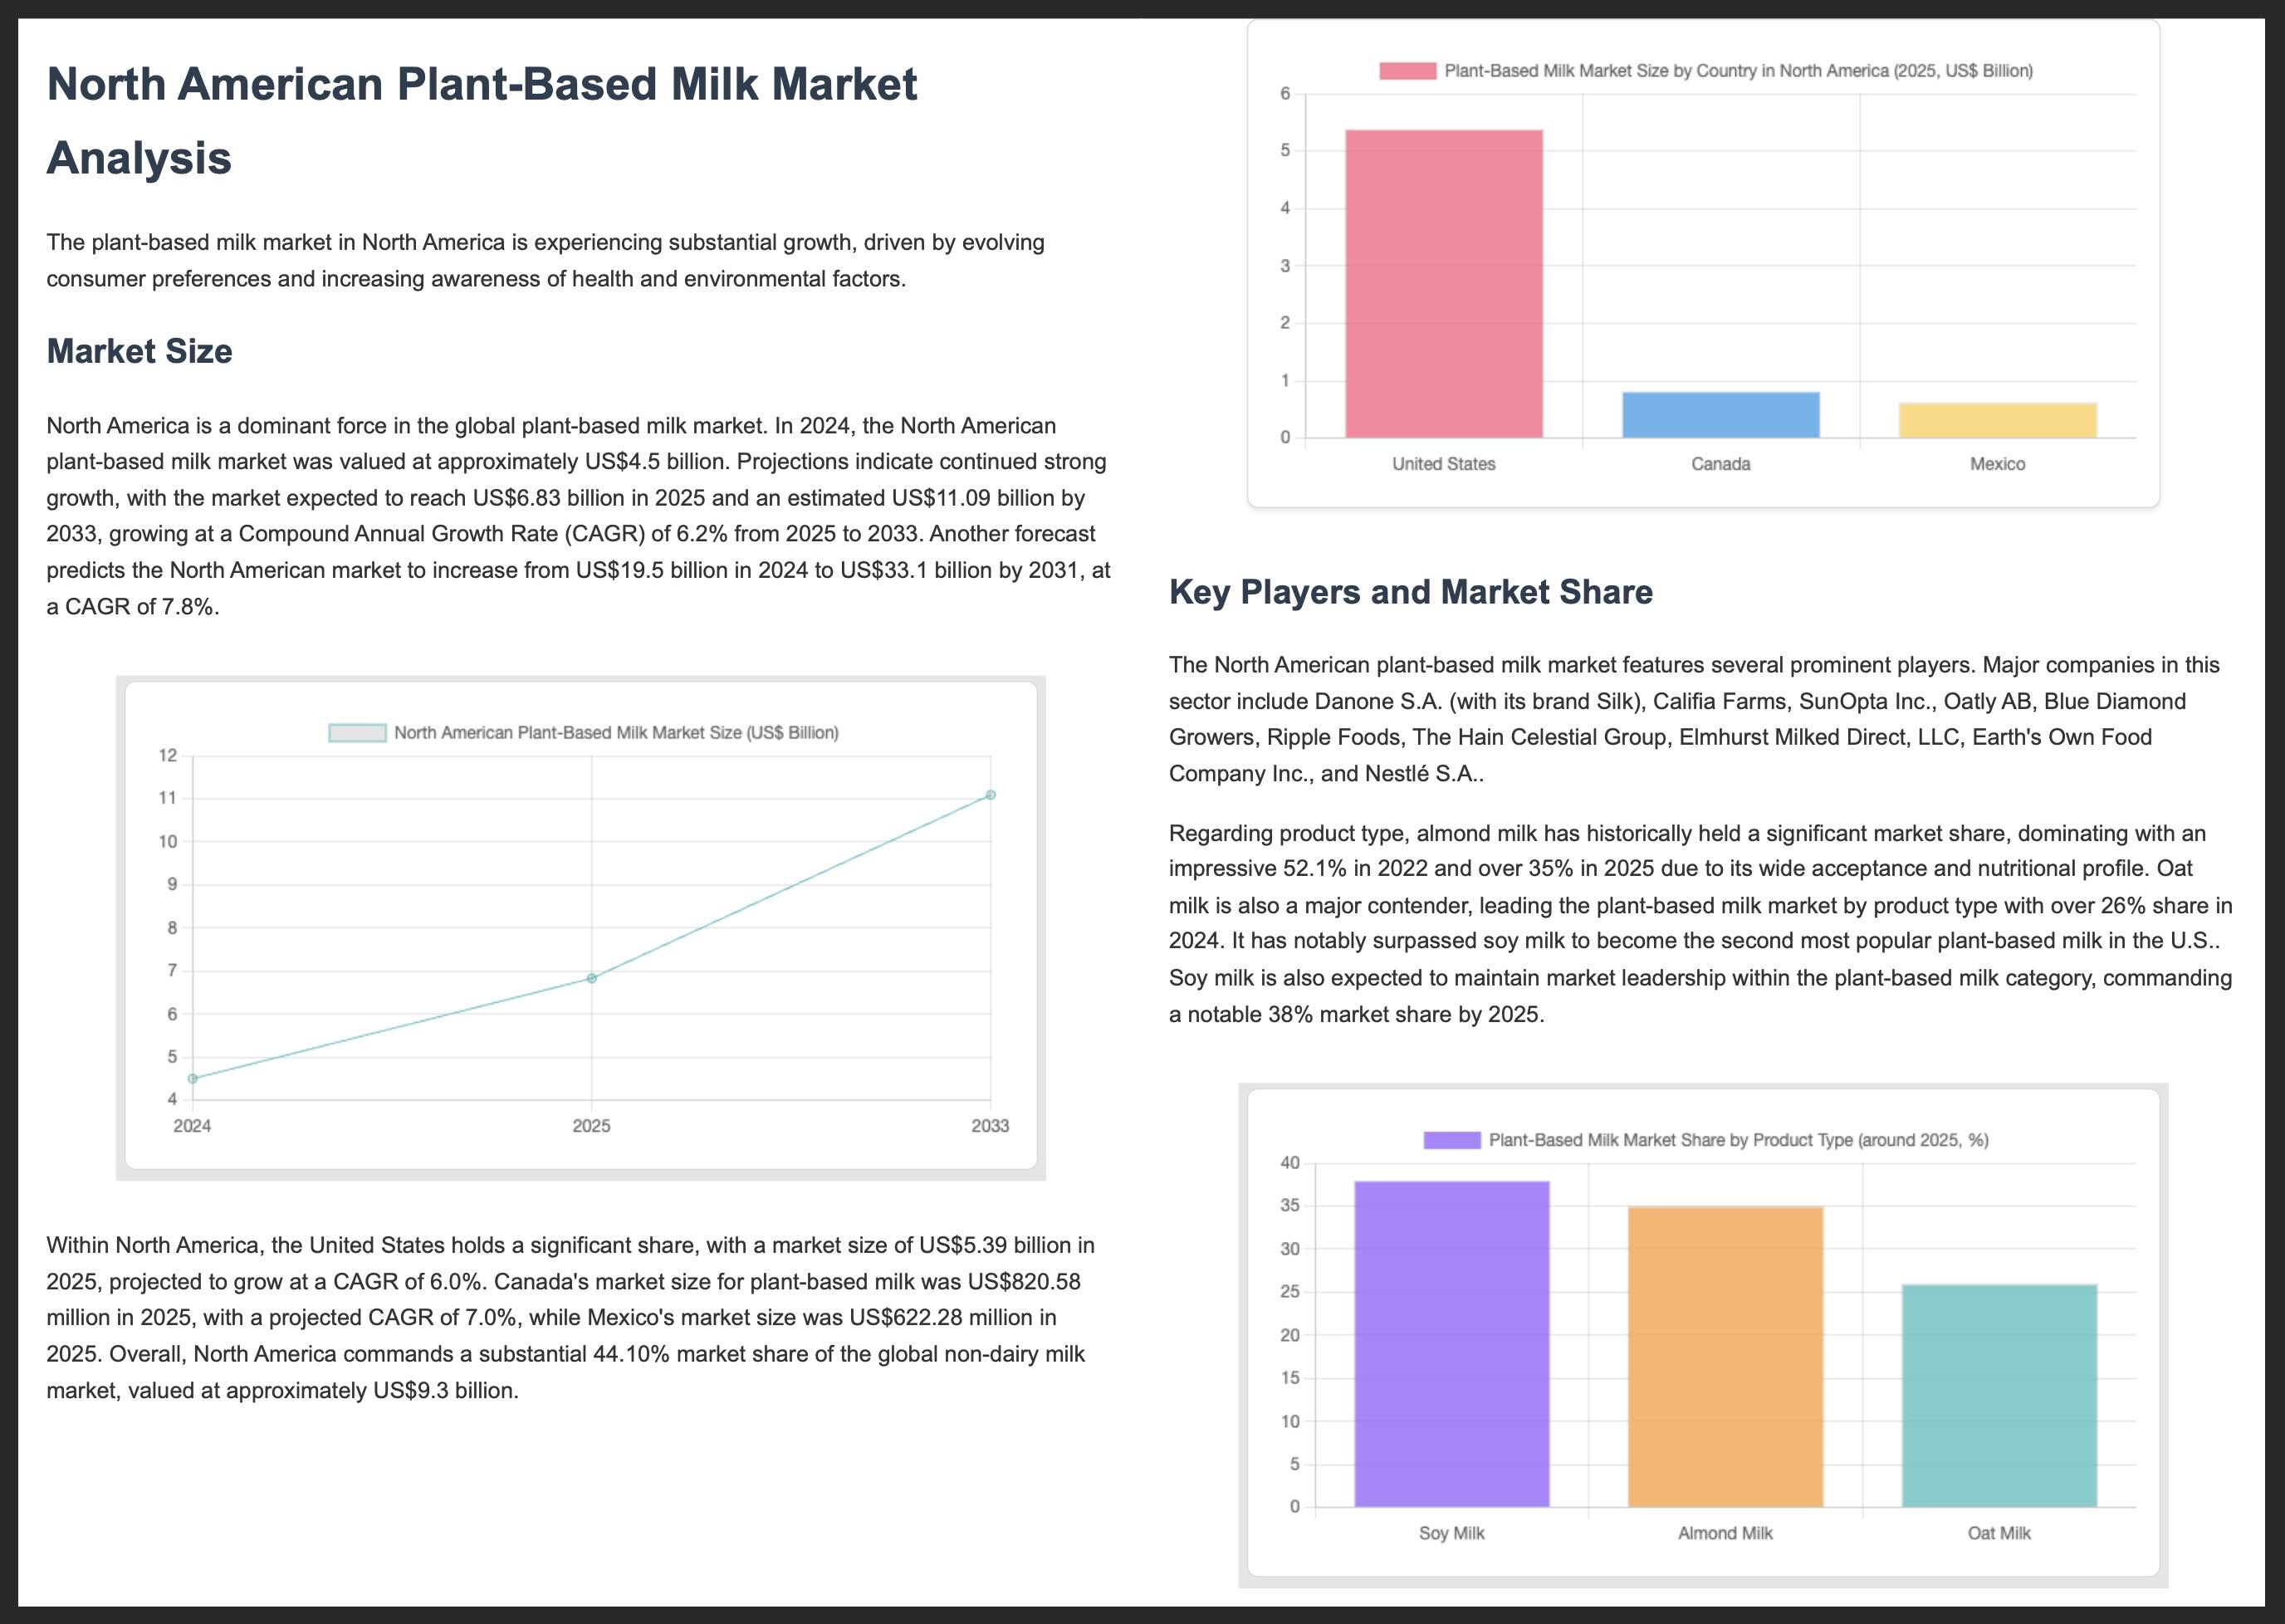
เมื่อเสร็จแล้ว ระบบจะสร้างไฟล์ report.pdf ที่มีการวิเคราะห์ตลาดในไดเรกทอรีโปรเจ็กต์
ด้านล่างนี้ คุณจะเห็น 2 หน้าแรกของรายงาน PDF ตัวอย่าง
แหล่งข้อมูลเพิ่มเติม
ดูข้อมูลเพิ่มเติมเกี่ยวกับการสร้างด้วย Gemini และ AI SDK ได้จากแหล่งข้อมูลต่อไปนี้