Vercel の AI SDK は、TypeScript で AI 搭載のアプリケーション、ユーザー インターフェース、エージェントを構築するための強力なオープンソース ライブラリです。
このガイドでは、AI SDK を使用して Google Generative AI Provider 経由で Gemini API に接続し、自動化された市場トレンド分析を行う Node.js アプリケーションを TypeScript で構築する手順について説明します。最終的なアプリケーションは次のようになります。
- Gemini と Google 検索を使用して、現在の市場トレンドを調査します。
- 調査から構造化データを抽出し、グラフを生成します。
- 調査とグラフを組み合わせて、プロフェッショナルな HTML レポートを作成し、PDF として保存します。
前提条件
このガイドを完了するには、次のものが必要です。
- Gemini API キー。Google AI Studio で無料で作成できます。
- Node.js バージョン 18 以降。
- パッケージ マネージャー(
npm、pnpm、yarnなど)。
アプリケーションの設定
まず、プロジェクト用の新しいディレクトリを作成し、初期化します。
npm
mkdir market-trend-appcd market-trend-appnpm init -y
pnpm
mkdir market-trend-appcd market-trend-apppnpm init
yarn
mkdir market-trend-appcd market-trend-appyarn init -y
依存関係のインストール
次に、AI SDK、Google Generative AI Provider、その他の必要な依存関係をインストールします。
npm
npm install ai @ai-sdk/google zodnpm install -D @types/node tsx typescript && npx tsc --init
TypeScript コンパイラのエラーを防ぐため、生成された tsconfig.json で次の行をコメントアウトします。
//"verbatimModuleSyntax": true,
pnpm
pnpm add ai @ai-sdk/google zodpnpm add -D @types/node tsx typescript
yarn
yarn add ai @ai-sdk/google zodyarn add -D @types/node tsx typescript && yarn tsc --init
TypeScript コンパイラのエラーを防ぐため、生成された tsconfig.json で次の行をコメントアウトします。
//"verbatimModuleSyntax": true,
このアプリケーションでは、グラフのレンダリングと PDF の作成に、サードパーティ パッケージのPuppeteer と Chart.js も使用します。
npm
npm install puppeteer chart.jsnpm install -D @types/chart.js
pnpm
pnpm add puppeteer chart.jspnpm add -D @types/chart.js
yarn
yarn add puppeteer chart.jsyarn add -D @types/chart.js
puppeteer パッケージでは、Chromium ブラウザをダウンロードするスクリプトを実行する必要があります。パッケージ マネージャーから承認を求められる場合があります。その場合は、スクリプトを承認してください。
API キーを構成する
GOOGLE_GENERATIVE_AI_API_KEY 環境変数に Gemini API キーを設定します。Google 生成 AI Provider は、この環境変数で API キーを自動的に検索します。
MacOS/Linux
export GOOGLE_GENERATIVE_AI_API_KEY="YOUR_API_KEY_HERE"Powershell
setx GOOGLE_GENERATIVE_AI_API_KEY "YOUR_API_KEY_HERE"アプリを作成する
次に、アプリケーションのメインファイルを作成します。プロジェクト ディレクトリに main.ts という名前の新しいファイルを作成します。このファイルでロジックを段階的に構築します。
すべてが正しく設定されていることを確認する簡単なテストとして、次のコードを main.ts に追加します。この基本的な例では、generateText を使用して Gemini から簡単なレスポンスを取得します。
import { google } from "@ai-sdk/google";
import { generateText } from "ai";

async function main() {
  const { text } = await generateText({
    model: google("gemini-3.5-flash"),
    prompt: 'What is plant-based milk?',
  });

  console.log(text);
}

main().catch(console.error);
複雑さを増す前に、このスクリプトを実行して、環境が正しく構成されていることを確認します。ターミナルで次のコマンドを実行します。
npm
npx tsc && node main.jspnpm
pnpm tsx main.tsyarn
yarn tsc && node main.jsすべてが正しく設定されている場合は、Gemini のレスポンスがコンソールに出力されます。
Google 検索で市場調査を行う
最新の情報を取得するには、Gemini の Google 検索ツールを有効にします。このツールが有効になっている場合、モデルはウェブを検索してプロンプトに回答し、使用したソースを返します。
main.ts の内容を次のコードに置き換えて、分析の最初のステップを実行します。
import { google } from "@ai-sdk/google";
import { generateText } from "ai";

async function main() {
  // Step 1: Search market trends
  const { text: marketTrends, sources } = await generateText({
    model: google("gemini-3.5-flash"),
    tools: {
      google_search: google.tools.googleSearch({}),
    },
    prompt: `Search the web for market trends for plant-based milk in North America for 2024-2025.
          I need to know the market size, key players and their market share, and primary consumer drivers.
          `,
  });

  console.log("Market trends found:\n", marketTrends);
  // To see the sources, uncomment the following line:
  // console.log("Sources:\n", sources);
}

main().catch(console.error);
グラフデータを抽出する
次に、調査テキストを処理して、グラフに適した構造化データを抽出します。AI SDK の generateObject 関数と zod スキーマを使用して、正確なデータ構造を定義します。
また、この構造化データを Chart.js が理解できる構成に変換するヘルパー関数も作成します。
次のコードを main.ts に追加します。新しいインポートと追加された「ステップ 2」に注意してください。
import { google } from "@ai-sdk/google";
import { generateText, generateObject } from "ai";
import { z } from "zod/v4";
import { ChartConfiguration } from "chart.js";

// Helper function to create Chart.js configurations
function createChartConfig({labels, data, label, type, colors,}: {
  labels: string[];
  data: number[];
  label: string;
  type: "bar" | "line";
  colors: string[];
}): ChartConfiguration {
  return {
    type: type,
    data: {
      labels: labels,
      datasets: [
        {
          label: label,
          data: data,
          borderWidth: 1,
          ...(type === "bar" && { backgroundColor: colors }),
          ...(type === "line" && colors.length > 0 && { borderColor: colors[0] }),
        },
      ],
    },
    options: {
      animation: { duration: 0 }, // Disable animations for static PDF rendering
    },
  };
}

async function main() {
  // Step 1: Search market trends
  const { text: marketTrends, sources } = await generateText({
    model: google("gemini-3.5-flash"),
    tools: {
      google_search: google.tools.googleSearch({}),
    },
    prompt: `Search the web for market trends for plant-based milk in North America for 2024-2025.
          I need to know the market size, key players and their market share, and primary consumer drivers.
          `,
  });

  console.log("Market trends found.");

  // Step 2: Extract chart data
  const { object: chartData } = await generateObject({
    model: google("gemini-3.5-flash"),
    schema: z.object({
      chartConfigurations: z
        .array(
          z.object({
            type: z.enum(["bar", "line"]).describe('The type of chart to generate. Either "bar" or "line"',),
            labels: z.array(z.string()).describe("A list of chart labels"),
            data: z.array(z.number()).describe("A list of the chart data"),
            label: z.string().describe("A label for the chart"),
            colors: z.array(z.string()).describe('A list of colors to use for the chart, e.g. "rgba(255, 99, 132, 0.8)"',),
          }),
        )
        .describe("A list of chart configurations"),
    }),
    prompt: `Given the following market trends text, come up with a list of 1-3 meaningful bar or line charts
    and generate chart data.

Market Trends:
${marketTrends}
`,
  });

  const chartConfigs = chartData.chartConfigurations.map(createChartConfig);

  console.log("Chart configurations generated.");
}

main().catch(console.error);
最終レポートを生成する
最後のステップでは、Gemini にエキスパート レポート作成者として機能するように指示します。 市場調査、グラフの構成、HTML レポートを作成するための明確な手順を提供します。次に、 Puppeteer を使用してこの HTML をレンダリングし、PDF として保存します。
最後の puppeteer インポートと「ステップ 3」を main.ts ファイルに追加します。
// ... (imports from previous step)
import puppeteer from "puppeteer";

// ... (createChartConfig helper function from previous step)

async function main() {
  // ... (Step 1 and 2 from previous step)

  // Step 3: Generate the final HTML report and save it as a PDF
  const { text: htmlReport } = await generateText({
    model: google("gemini-3.5-flash"),
    prompt: `You are an expert financial analyst and report writer.
    Your task is to generate a comprehensive market analysis report in HTML format.

    **Instructions:**
    1.  Write a full HTML document.
    2.  Use the provided "Market Trends" text to write the main body of the report. Structure it with clear headings and paragraphs.
    3.  Incorporate the provided "Chart Configurations" to visualize the data. For each chart, you MUST create a unique <canvas> element and a corresponding <script> block to render it using Chart.js.
    4.  Reference the "Sources" at the end of the report.
    5.  Do not include any placeholder data; use only the information provided.
    6.  Return only the raw HTML code.

    **Chart Rendering Snippet:**
    Include this script in the head of the HTML: <script src="https://cdn.jsdelivr.net/npm/chart.js"></script>
    For each chart, use a structure like below, ensuring the canvas 'id' is unique for each chart, and apply the correspinding config:

    ---
    <div style="width: 800px; height: 600px;">
      <canvas id="chart1"></canvas>
    </div>
    <script>
      new Chart(document.getElementById('chart1'), config);
    </script>
    ---
    (For the second chart, use 'chart2' and the corresponding config, and so on.)

    **Data:**
    - Market Trends: ${marketTrends}
    - Chart Configurations: ${JSON.stringify(chartConfigs)}
    - Sources: ${JSON.stringify(sources)}
    `,
  });

  // LLMs may wrap the HTML in a markdown code block, so strip it.
  const finalHtml = htmlReport.replace(/^```html\n/, "").replace(/\n```$/, "");

  const browser = await puppeteer.launch();
  const page = await browser.newPage();
  await page.setContent(finalHtml);
  await page.pdf({ path: "report.pdf", format: "A4" });
  await browser.close();

  console.log("\nReport generated successfully: report.pdf");
}

main().catch(console.error);
アプリケーションの実行
これで、アプリケーションを実行する準備ができました。ターミナルで次のコマンドを実行します。
npm
npx tsc && node main.jspnpm
pnpm tsx main.tsyarn
yarn tsc && node main.jsスクリプトが各ステップを実行すると、ターミナルにログが表示されます。
完了すると、プロジェクト ディレクトリに市場分析を含む report.pdf ファイルが作成されます。
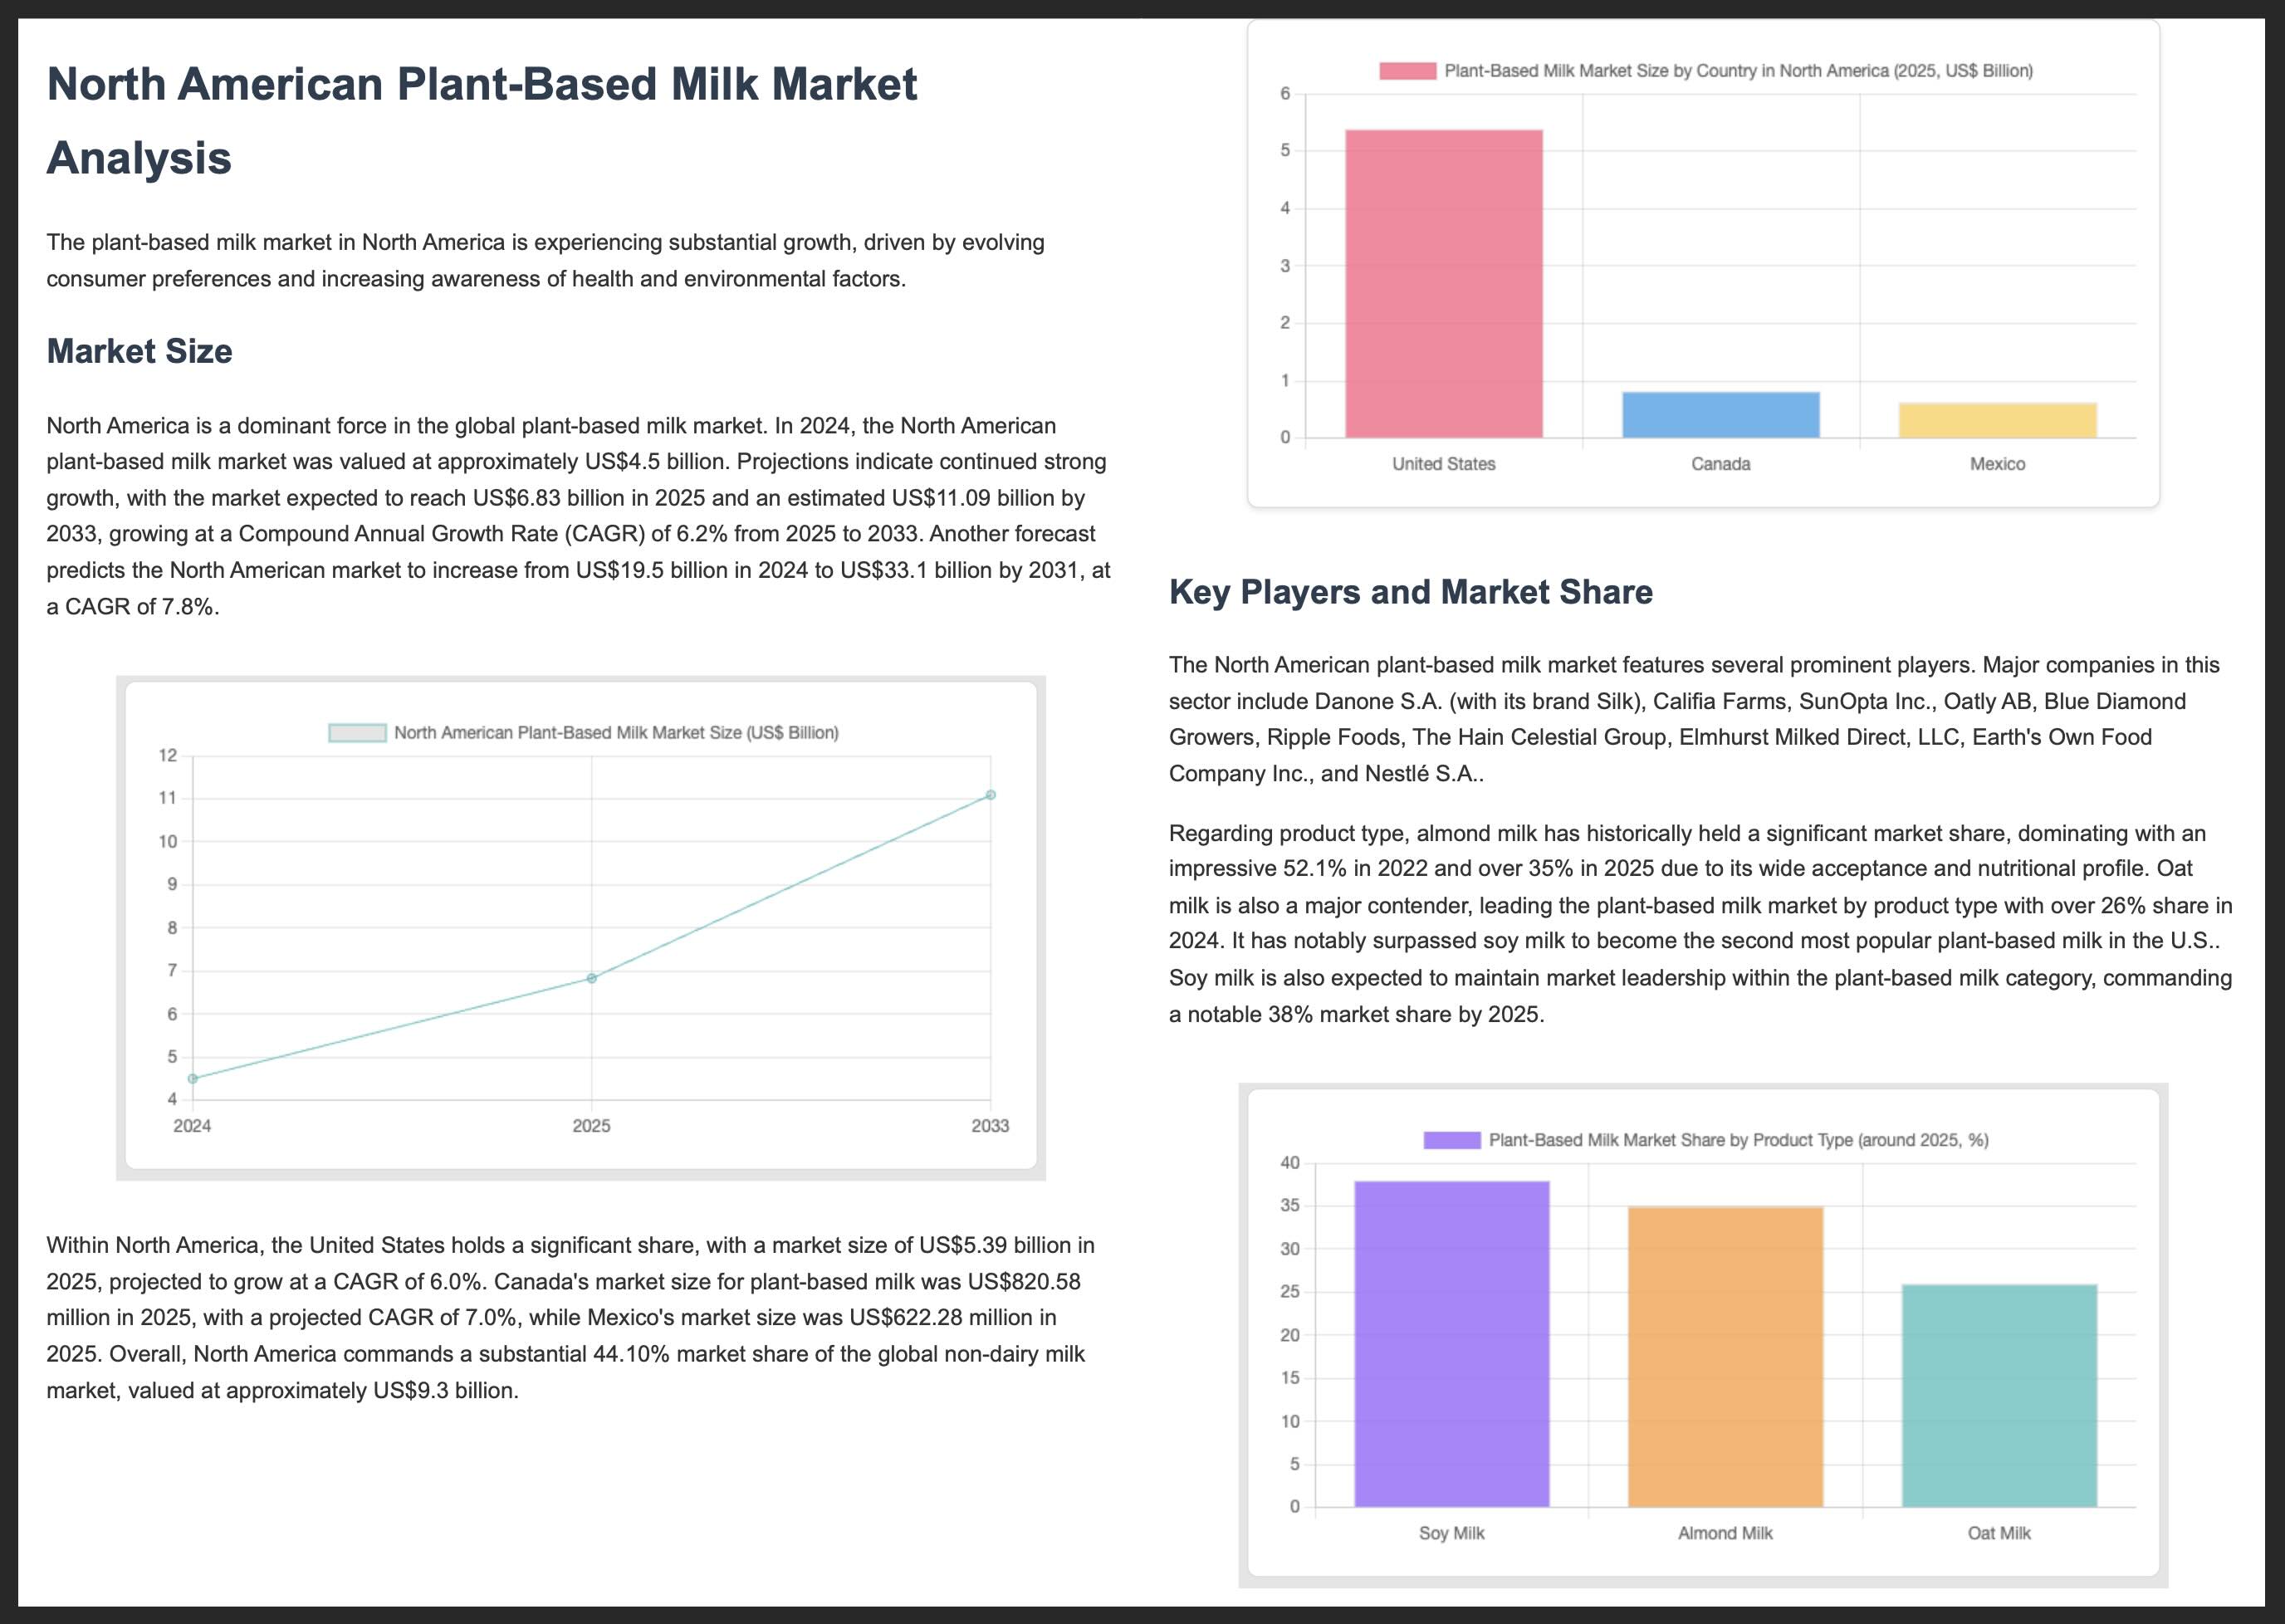
以下に、PDF レポートの最初の 2 ページを示します。
その他のリソース
Gemini と AI SDK を使用したビルドの詳細については、次のリソースをご覧ください。