AI SDK by Vercel היא ספרייה עוצמתית בקוד פתוח ליצירת אפליקציות, ממשקי משתמש וסוכנים מבוססי-AI ב-TypeScript.
במדריך הזה נסביר איך ליצור אפליקציית Node.js עם TypeScript שמשתמשת ב-AI SDK כדי להתחבר ל-Gemini API דרך Google Generative AI Provider ולבצע ניתוח אוטומטי של מגמות בשוק. הבקשה הסופית:
- אתם יכולים להשתמש ב-Gemini עם חיפוש Google כדי לחקור מגמות שוק עדכניות.
- לחלץ נתונים מובְנים מהמחקר כדי ליצור תרשימים.
- אפשר לשלב את המחקר והתרשימים בדוח HTML מקצועי ולשמור אותו כקובץ PDF.
דרישות מוקדמות
כדי להשלים את ההדרכה הזו, תצטרכו:
- מפתח Gemini API. אפשר ליצור מודל בחינם ב-Google AI Studio.
- Node.js מגרסה 18 ואילך.
- כלי לניהול חבילות, כמו
npm,pnpmאוyarn.
הגדרת האפליקציה
קודם יוצרים ספרייה חדשה לפרויקט ומפעילים אותה.
npm
mkdir market-trend-appcd market-trend-appnpm init -y
pnpm
mkdir market-trend-appcd market-trend-apppnpm init
חוטי סריגה
mkdir market-trend-appcd market-trend-appyarn init -y
התקנת יחסי תלות
לאחר מכן, מתקינים את ה-AI SDK, את ספק ה-AI הגנרטיבי של Google ותלותיות נדרשות אחרות.
npm
npm install ai @ai-sdk/google zodnpm install -D @types/node tsx typescript && npx tsc --init
כדי למנוע שגיאה בקומפיילר של TypeScript, מוסיפים הערה לשורה הבאה בקובץ tsconfig.json שנוצר:
//"verbatimModuleSyntax": true,
pnpm
pnpm add ai @ai-sdk/google zodpnpm add -D @types/node tsx typescript
חוטי סריגה
yarn add ai @ai-sdk/google zodyarn add -D @types/node tsx typescript && yarn tsc --init
כדי למנוע שגיאה בקומפיילר של TypeScript, מוסיפים הערה לשורה הבאה בקובץ tsconfig.json שנוצר:
//"verbatimModuleSyntax": true,
האפליקציה הזו תשתמש גם בחבילות של צד שלישי Puppeteer ו-Chart.js כדי לעבד תרשימים וליצור קובץ PDF:
npm
npm install puppeteer chart.jsnpm install -D @types/chart.js
pnpm
pnpm add puppeteer chart.jspnpm add -D @types/chart.js
חוטי סריגה
yarn add puppeteer chart.jsyarn add -D @types/chart.js
כדי להוריד את דפדפן Chromium, צריך להריץ סקריפט בחבילה puppeteer. יכול להיות שמנהל החבילות יבקש אישור, לכן חשוב לאשר את הסקריפט כשמוצגת בקשה.
הגדרת מפתח API
מגדירים את משתנה הסביבה GOOGLE_GENERATIVE_AI_API_KEY עם מפתח Gemini API. ספק ה-AI הגנרטיבי של Google מחפש באופן אוטומטי את מפתח ה-API שלכם במשתנה הסביבה הזה.
MacOS/Linux
export GOOGLE_GENERATIVE_AI_API_KEY="YOUR_API_KEY_HERE"Powershell
setx GOOGLE_GENERATIVE_AI_API_KEY "YOUR_API_KEY_HERE"יצירת האפליקציה
עכשיו ניצור את הקובץ הראשי של האפליקציה. יוצרים קובץ חדש בשם main.ts בספריית הפרויקט. תבנו את הלוגיקה בקובץ הזה שלב אחר שלב.
כדי לבצע בדיקה מהירה ולוודא שהכול מוגדר בצורה נכונה, מוסיפים את הקוד הבא אל main.ts. בדוגמה הבסיסית הזו נעשה שימוש ב-generateText כדי לקבל תשובה פשוטה מ-Gemini.
import { google } from "@ai-sdk/google";
import { generateText } from "ai";

async function main() {
  const { text } = await generateText({
    model: google("gemini-3.5-flash"),
    prompt: 'What is plant-based milk?',
  });

  console.log(text);
}

main().catch(console.error);
לפני שמוסיפים עוד מורכבות, כדאי להריץ את הסקריפט הזה כדי לוודא שהסביבה מוגדרת בצורה נכונה. מריצים את הפקודה הבאה בטרמינל:
npm
npx tsc && node main.jspnpm
pnpm tsx main.tsחוטי סריגה
yarn tsc && node main.jsאם הכל מוגדר בצורה נכונה, תראו את התשובה של Gemini מודפסת במסוף.
ביצוע מחקר שוק באמצעות חיפוש Google
כדי לקבל מידע עדכני, אפשר להפעיל את הכלי חיפוש Google ב-Gemini. כשהכלי הזה פעיל, המודל יכול לחפש באינטרנט כדי לענות על ההנחיה, ויחזיר את המקורות שבהם הוא השתמש.
מחליפים את התוכן של main.ts בקוד הבא כדי לבצע את השלב הראשון בניתוח.
import { google } from "@ai-sdk/google";
import { generateText } from "ai";

async function main() {
  // Step 1: Search market trends
  const { text: marketTrends, sources } = await generateText({
    model: google("gemini-3.5-flash"),
    tools: {
      google_search: google.tools.googleSearch({}),
    },
    prompt: `Search the web for market trends for plant-based milk in North America for 2024-2025.
          I need to know the market size, key players and their market share, and primary consumer drivers.
          `,
  });

  console.log("Market trends found:\n", marketTrends);
  // To see the sources, uncomment the following line:
  // console.log("Sources:\n", sources);
}

main().catch(console.error);
חילוץ נתוני תרשים
עכשיו ננתח את הטקסט של המחקר כדי לחלץ נתונים מובְנים שמתאימים לתרשימים. כדי להגדיר את מבנה הנתונים המדויק, משתמשים בפונקציה generateObject של ה-SDK של ה-AI יחד עם סכימה zod.
צריך גם ליצור פונקציית עזר להמרת הנתונים המובְנים האלה להגדרה ש-Chart.js יכול להבין.
מוסיפים את הקוד הבא אל main.ts. שימו לב לייבוא החדש ולשלב 2 שנוסף.
import { google } from "@ai-sdk/google";
import { generateText, generateObject } from "ai";
import { z } from "zod/v4";
import { ChartConfiguration } from "chart.js";

// Helper function to create Chart.js configurations
function createChartConfig({labels, data, label, type, colors,}: {
  labels: string[];
  data: number[];
  label: string;
  type: "bar" | "line";
  colors: string[];
}): ChartConfiguration {
  return {
    type: type,
    data: {
      labels: labels,
      datasets: [
        {
          label: label,
          data: data,
          borderWidth: 1,
          ...(type === "bar" && { backgroundColor: colors }),
          ...(type === "line" && colors.length > 0 && { borderColor: colors[0] }),
        },
      ],
    },
    options: {
      animation: { duration: 0 }, // Disable animations for static PDF rendering
    },
  };
}

async function main() {
  // Step 1: Search market trends
  const { text: marketTrends, sources } = await generateText({
    model: google("gemini-3.5-flash"),
    tools: {
      google_search: google.tools.googleSearch({}),
    },
    prompt: `Search the web for market trends for plant-based milk in North America for 2024-2025.
          I need to know the market size, key players and their market share, and primary consumer drivers.
          `,
  });

  console.log("Market trends found.");

  // Step 2: Extract chart data
  const { object: chartData } = await generateObject({
    model: google("gemini-3.5-flash"),
    schema: z.object({
      chartConfigurations: z
        .array(
          z.object({
            type: z.enum(["bar", "line"]).describe('The type of chart to generate. Either "bar" or "line"',),
            labels: z.array(z.string()).describe("A list of chart labels"),
            data: z.array(z.number()).describe("A list of the chart data"),
            label: z.string().describe("A label for the chart"),
            colors: z.array(z.string()).describe('A list of colors to use for the chart, e.g. "rgba(255, 99, 132, 0.8)"',),
          }),
        )
        .describe("A list of chart configurations"),
    }),
    prompt: `Given the following market trends text, come up with a list of 1-3 meaningful bar or line charts
    and generate chart data.

Market Trends:
${marketTrends}
`,
  });

  const chartConfigs = chartData.chartConfigurations.map(createChartConfig);

  console.log("Chart configurations generated.");
}

main().catch(console.error);
יצירת הדוח הסופי
בשלב האחרון, נותנים ל-Gemini הנחיה לפעול ככותב דוחות מומחה. מספקים לו את מחקר השוק, את הגדרות התרשים וסט ברור של הוראות לבניית דוח HTML. לאחר מכן, משתמשים ב-Puppeteer כדי לעבד את ה-HTML הזה ולשמור אותו כקובץ PDF.
מוסיפים את הייבוא הסופי puppeteer ואת 'שלב 3' לקובץ main.ts.
// ... (imports from previous step)
import puppeteer from "puppeteer";

// ... (createChartConfig helper function from previous step)

async function main() {
  // ... (Step 1 and 2 from previous step)

  // Step 3: Generate the final HTML report and save it as a PDF
  const { text: htmlReport } = await generateText({
    model: google("gemini-3.5-flash"),
    prompt: `You are an expert financial analyst and report writer.
    Your task is to generate a comprehensive market analysis report in HTML format.

    **Instructions:**
    1.  Write a full HTML document.
    2.  Use the provided "Market Trends" text to write the main body of the report. Structure it with clear headings and paragraphs.
    3.  Incorporate the provided "Chart Configurations" to visualize the data. For each chart, you MUST create a unique <canvas> element and a corresponding <script> block to render it using Chart.js.
    4.  Reference the "Sources" at the end of the report.
    5.  Do not include any placeholder data; use only the information provided.
    6.  Return only the raw HTML code.

    **Chart Rendering Snippet:**
    Include this script in the head of the HTML: <script src="https://cdn.jsdelivr.net/npm/chart.js"></script>
    For each chart, use a structure like below, ensuring the canvas 'id' is unique for each chart, and apply the correspinding config:

    ---
    <div style="width: 800px; height: 600px;">
      <canvas id="chart1"></canvas>
    </div>
    <script>
      new Chart(document.getElementById('chart1'), config);
    </script>
    ---
    (For the second chart, use 'chart2' and the corresponding config, and so on.)

    **Data:**
    - Market Trends: ${marketTrends}
    - Chart Configurations: ${JSON.stringify(chartConfigs)}
    - Sources: ${JSON.stringify(sources)}
    `,
  });

  // LLMs may wrap the HTML in a markdown code block, so strip it.
  const finalHtml = htmlReport.replace(/^```html\n/, "").replace(/\n```$/, "");

  const browser = await puppeteer.launch();
  const page = await browser.newPage();
  await page.setContent(finalHtml);
  await page.pdf({ path: "report.pdf", format: "A4" });
  await browser.close();

  console.log("\nReport generated successfully: report.pdf");
}

main().catch(console.error);
הפעלת האפליקציה
עכשיו אפשר להפעיל את האפליקציה. מריצים את הפקודה הבאה במסוף:
npm
npx tsc && node main.jspnpm
pnpm tsx main.tsחוטי סריגה
yarn tsc && node main.jsבמסוף יוצגו נתוני רישום בזמן שהסקריפט מבצע כל שלב.
אחרי שהניתוח יסתיים, ייווצר קובץ report.pdf עם ניתוח השוק בספריית הפרויקט.
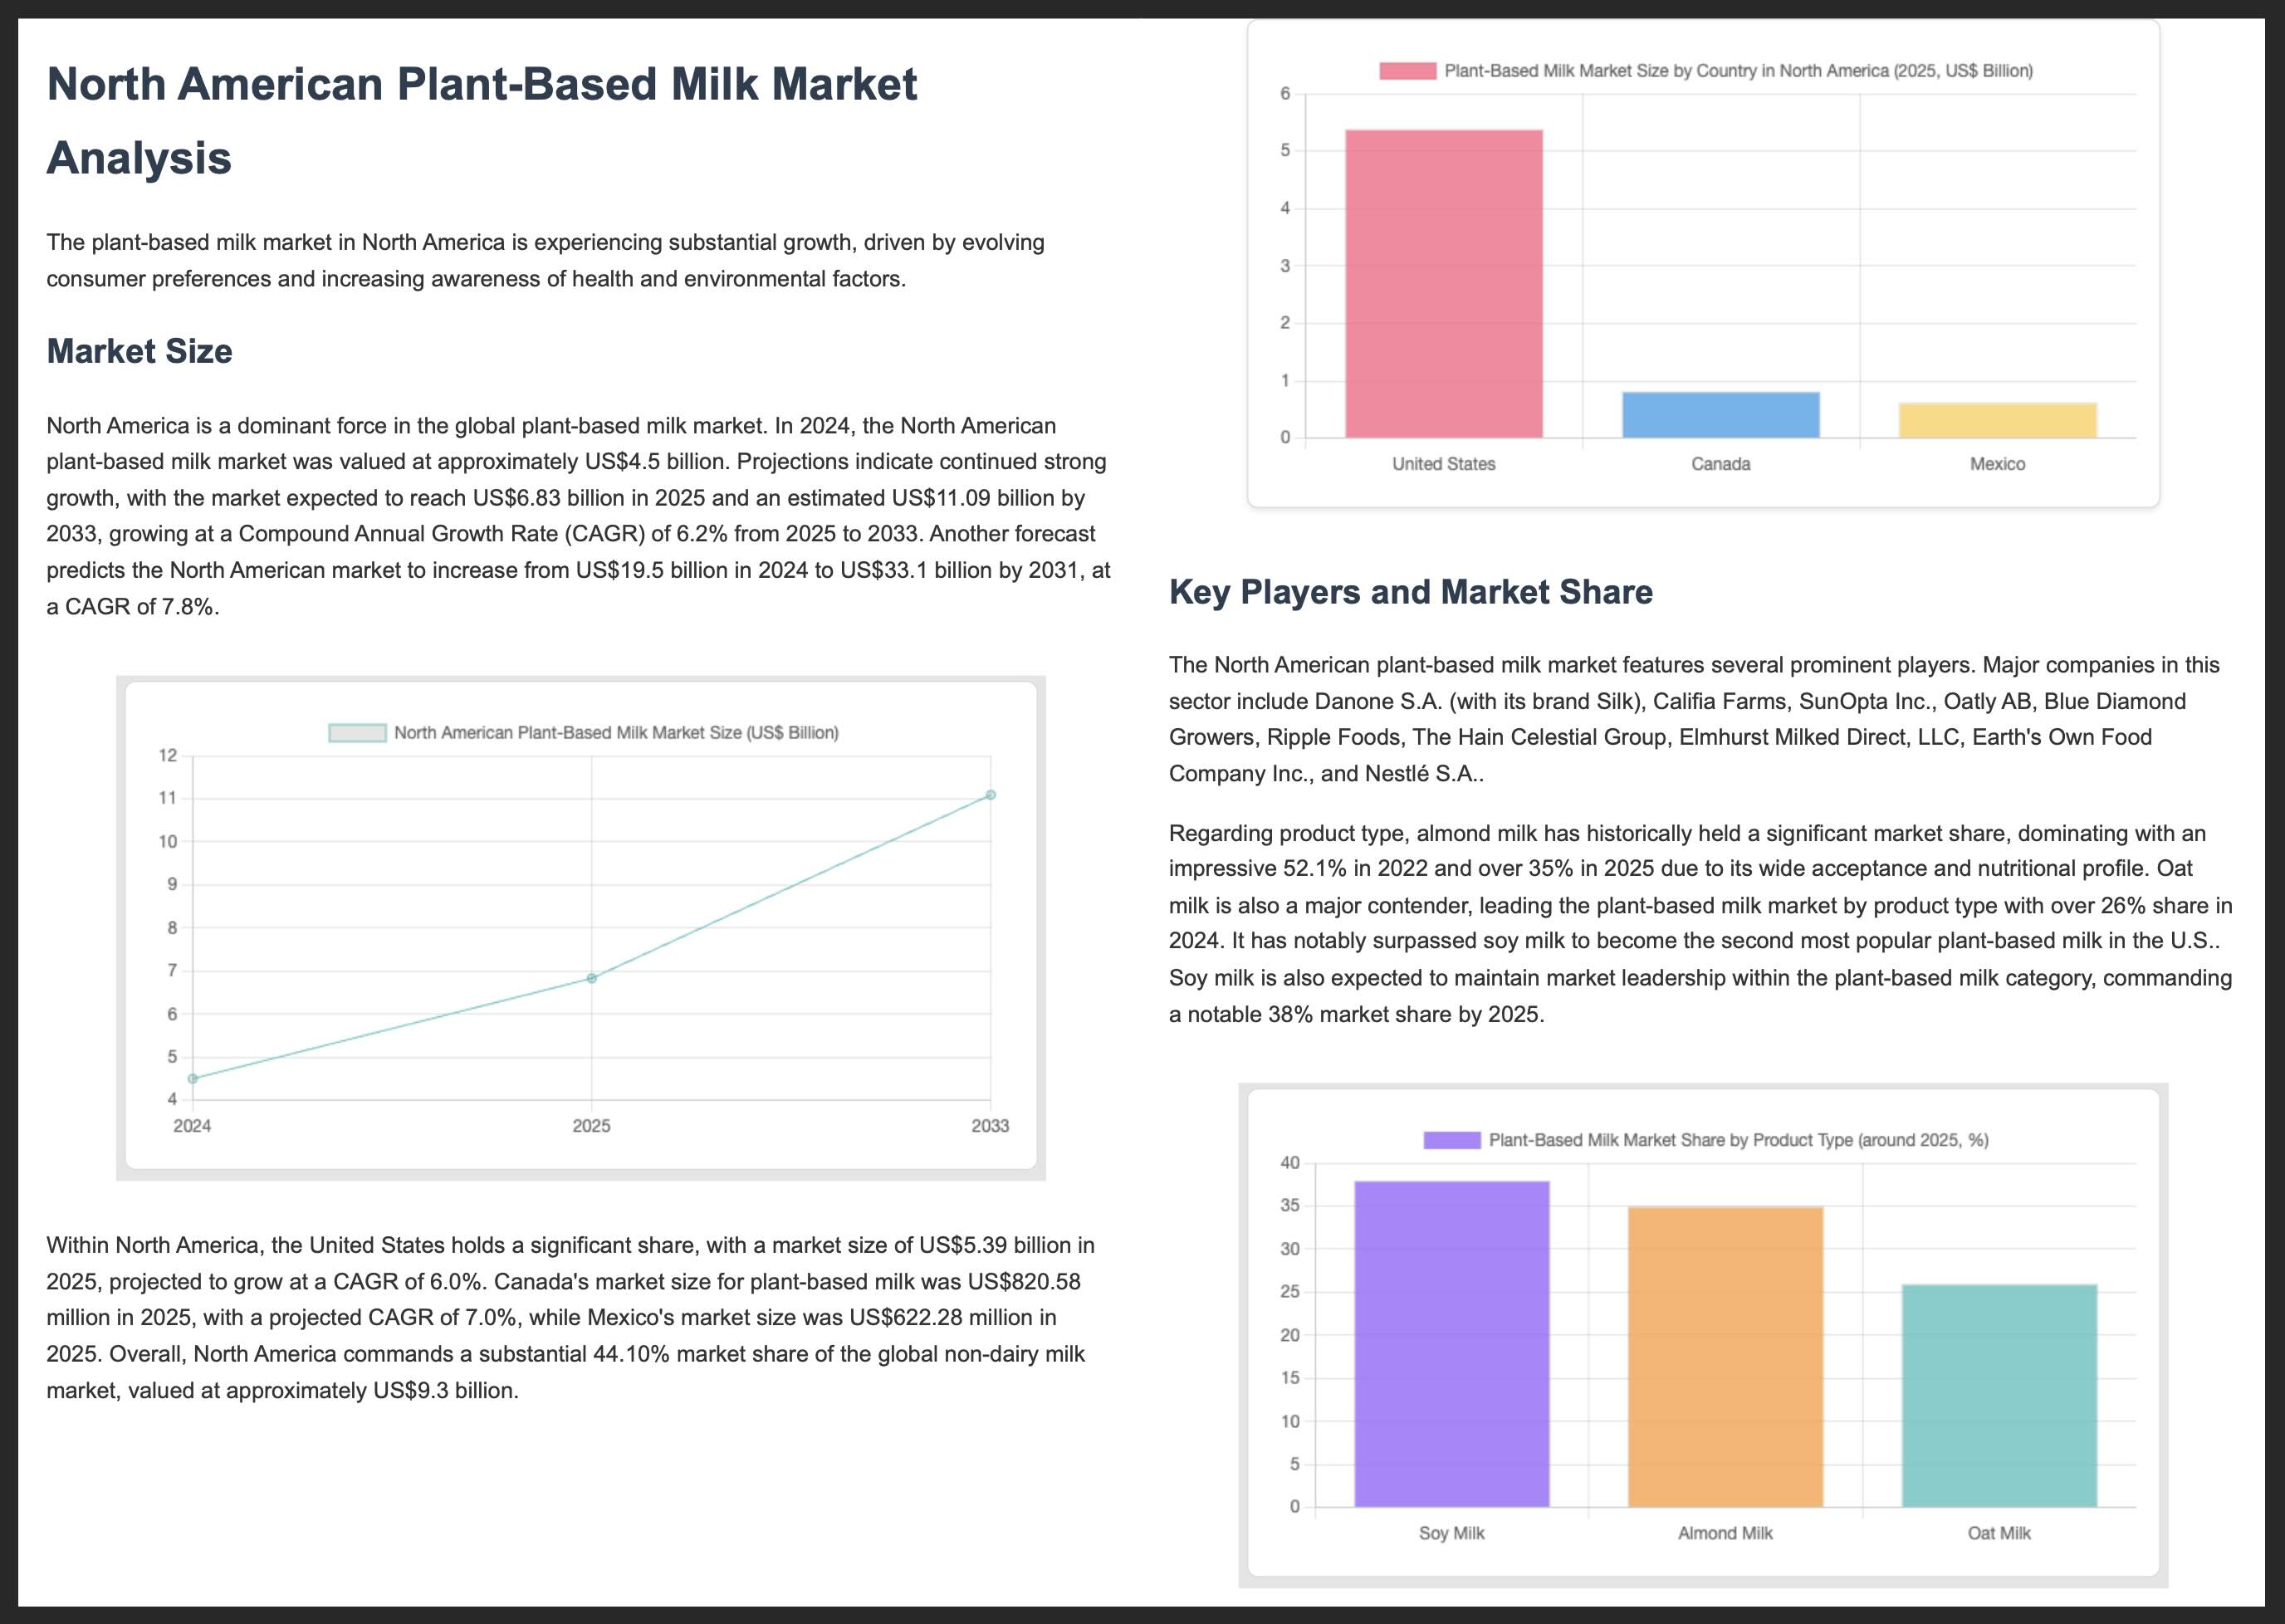
בהמשך מוצגים שני הדפים הראשונים של דוח PDF לדוגמה:
מקורות מידע נוספים
כדי לקבל מידע נוסף על פיתוח באמצעות Gemini ו-AI SDK, אפשר לעיין במקורות המידע הבאים: