Vercel 的 AI SDK 是一个强大的开源库,可用于在 TypeScript 中构建 AI 赋能的应用、界面和智能体。
本指南将引导您构建一个使用 TypeScript 的 Node.js 应用,该应用使用 AI SDK 通过 Google 生成式 AI Provider 连接到 Gemini API,并执行自动化市场趋势分析。最终应用将:
- 将 Gemini 与 Google 搜索搭配使用,研究当前的市场趋势。
- 从研究中提取结构化数据以生成图表。
- 将研究和图表合并为专业的 HTML 报告,并将其另存为 PDF。
前提条件
如需完成本指南,您需要:
- Gemini API 密钥。您可以在 Google AI Studio 中免费创建 API 密钥。
- Node.js 18 或更高版本。
- 软件包管理系统,例如
npm、pnpm或yarn。
设置应用
首先,为您的项目创建一个新目录并对其进行初始化。
npm
mkdir market-trend-appcd market-trend-appnpm init -y
pnpm
mkdir market-trend-appcd market-trend-apppnpm init
纱线
mkdir market-trend-appcd market-trend-appyarn init -y
安装依赖项
接下来,安装 AI SDK、Google 生成式 AI 提供程序和其他必需的依赖项。
npm
npm install ai @ai-sdk/google zodnpm install -D @types/node tsx typescript && npx tsc --init
为防止出现 TypeScript 编译器错误,请在生成的 tsconfig.json 中将以下行添加为注释:
//"verbatimModuleSyntax": true,
pnpm
pnpm add ai @ai-sdk/google zodpnpm add -D @types/node tsx typescript
纱线
yarn add ai @ai-sdk/google zodyarn add -D @types/node tsx typescript && yarn tsc --init
为防止出现 TypeScript 编译器错误,请在生成的 tsconfig.json 中将以下行添加为注释:
//"verbatimModuleSyntax": true,
此应用还将使用第三方软件包 Puppeteer 和 Chart.js 来渲染图表和创建 PDF:
npm
npm install puppeteer chart.jsnpm install -D @types/chart.js
pnpm
pnpm add puppeteer chart.jspnpm add -D @types/chart.js
纱线
yarn add puppeteer chart.jsyarn add -D @types/chart.js
puppeteer 软件包需要运行脚本才能下载 Chromium 浏览器。您的软件包管理器可能会要求您批准,因此请确保在出现提示时批准脚本。
配置 API 密钥
使用 Gemini API 密钥设置 GOOGLE_GENERATIVE_AI_API_KEY 环境变量。Google 生成式 AI 提供程序会自动在此环境变量中查找您的 API 密钥。
MacOS/Linux
export GOOGLE_GENERATIVE_AI_API_KEY="YOUR_API_KEY_HERE"PowerShell
setx GOOGLE_GENERATIVE_AI_API_KEY "YOUR_API_KEY_HERE"打造您的应用
现在,我们来创建应用的主文件。在项目目录中创建一个名为 main.ts 的新文件。您将在此文件中逐步构建逻辑。
如需进行快速测试以确保一切设置正确无误,请将以下代码添加到 main.ts。此基本示例使用 generateText 从 Gemini 获取简单回答。
import { google } from "@ai-sdk/google";
import { generateText } from "ai";

async function main() {
  const { text } = await generateText({
    model: google("gemini-3.5-flash"),
    prompt: 'What is plant-based milk?',
  });

  console.log(text);
}

main().catch(console.error);
在添加更多复杂性之前,请运行此脚本以验证您的环境是否已正确配置。在终端中运行以下命令:
npm
npx tsc && node main.jspnpm
pnpm tsx main.ts纱线
yarn tsc && node main.js如果一切设置正确无误,您会在控制台中看到 Gemini 的回答。
使用 Google 搜索开展市场调研
如需获取最新信息,您可以为 Gemini 启用 Google 搜索工具。启用此工具后,模型可以搜索网络来回答提示,并会返回其使用的来源。
将 main.ts 的内容替换为以下代码,以执行分析的第一步。
import { google } from "@ai-sdk/google";
import { generateText } from "ai";

async function main() {
  // Step 1: Search market trends
  const { text: marketTrends, sources } = await generateText({
    model: google("gemini-3.5-flash"),
    tools: {
      google_search: google.tools.googleSearch({}),
    },
    prompt: `Search the web for market trends for plant-based milk in North America for 2024-2025.
          I need to know the market size, key players and their market share, and primary consumer drivers.
          `,
  });

  console.log("Market trends found:\n", marketTrends);
  // To see the sources, uncomment the following line:
  // console.log("Sources:\n", sources);
}

main().catch(console.error);
提取图表数据
接下来,我们来处理研究文本,提取适合图表的结构化数据。使用 AI SDK 的 generateObject 函数以及 zod 架构来定义确切的数据结构。
此外,还要创建一个辅助函数,用于将此结构化数据转换为 Chart.js 可以理解的配置。
将以下代码添加到 main.ts。请注意新导入项和新增的“第 2 步”。
import { google } from "@ai-sdk/google";
import { generateText, generateObject } from "ai";
import { z } from "zod/v4";
import { ChartConfiguration } from "chart.js";

// Helper function to create Chart.js configurations
function createChartConfig({labels, data, label, type, colors,}: {
  labels: string[];
  data: number[];
  label: string;
  type: "bar" | "line";
  colors: string[];
}): ChartConfiguration {
  return {
    type: type,
    data: {
      labels: labels,
      datasets: [
        {
          label: label,
          data: data,
          borderWidth: 1,
          ...(type === "bar" && { backgroundColor: colors }),
          ...(type === "line" && colors.length > 0 && { borderColor: colors[0] }),
        },
      ],
    },
    options: {
      animation: { duration: 0 }, // Disable animations for static PDF rendering
    },
  };
}

async function main() {
  // Step 1: Search market trends
  const { text: marketTrends, sources } = await generateText({
    model: google("gemini-3.5-flash"),
    tools: {
      google_search: google.tools.googleSearch({}),
    },
    prompt: `Search the web for market trends for plant-based milk in North America for 2024-2025.
          I need to know the market size, key players and their market share, and primary consumer drivers.
          `,
  });

  console.log("Market trends found.");

  // Step 2: Extract chart data
  const { object: chartData } = await generateObject({
    model: google("gemini-3.5-flash"),
    schema: z.object({
      chartConfigurations: z
        .array(
          z.object({
            type: z.enum(["bar", "line"]).describe('The type of chart to generate. Either "bar" or "line"',),
            labels: z.array(z.string()).describe("A list of chart labels"),
            data: z.array(z.number()).describe("A list of the chart data"),
            label: z.string().describe("A label for the chart"),
            colors: z.array(z.string()).describe('A list of colors to use for the chart, e.g. "rgba(255, 99, 132, 0.8)"',),
          }),
        )
        .describe("A list of chart configurations"),
    }),
    prompt: `Given the following market trends text, come up with a list of 1-3 meaningful bar or line charts
    and generate chart data.

Market Trends:
${marketTrends}
`,
  });

  const chartConfigs = chartData.chartConfigurations.map(createChartConfig);

  console.log("Chart configurations generated.");
}

main().catch(console.error);
生成最终报告
在最后一步中,指示 Gemini 充当专业的报告撰写者。向其提供市场研究、图表配置以及用于构建 HTML 报告的一组明确说明。然后,使用 Puppeteer 渲染此 HTML 并将其另存为 PDF。
将最终的 puppeteer 导入和“步骤 3”添加到 main.ts 文件中。
// ... (imports from previous step)
import puppeteer from "puppeteer";

// ... (createChartConfig helper function from previous step)

async function main() {
  // ... (Step 1 and 2 from previous step)

  // Step 3: Generate the final HTML report and save it as a PDF
  const { text: htmlReport } = await generateText({
    model: google("gemini-3.5-flash"),
    prompt: `You are an expert financial analyst and report writer.
    Your task is to generate a comprehensive market analysis report in HTML format.

    **Instructions:**
    1.  Write a full HTML document.
    2.  Use the provided "Market Trends" text to write the main body of the report. Structure it with clear headings and paragraphs.
    3.  Incorporate the provided "Chart Configurations" to visualize the data. For each chart, you MUST create a unique <canvas> element and a corresponding <script> block to render it using Chart.js.
    4.  Reference the "Sources" at the end of the report.
    5.  Do not include any placeholder data; use only the information provided.
    6.  Return only the raw HTML code.

    **Chart Rendering Snippet:**
    Include this script in the head of the HTML: <script src="https://cdn.jsdelivr.net/npm/chart.js"></script>
    For each chart, use a structure like below, ensuring the canvas 'id' is unique for each chart, and apply the correspinding config:

    ---
    <div style="width: 800px; height: 600px;">
      <canvas id="chart1"></canvas>
    </div>
    <script>
      new Chart(document.getElementById('chart1'), config);
    </script>
    ---
    (For the second chart, use 'chart2' and the corresponding config, and so on.)

    **Data:**
    - Market Trends: ${marketTrends}
    - Chart Configurations: ${JSON.stringify(chartConfigs)}
    - Sources: ${JSON.stringify(sources)}
    `,
  });

  // LLMs may wrap the HTML in a markdown code block, so strip it.
  const finalHtml = htmlReport.replace(/^```html\n/, "").replace(/\n```$/, "");

  const browser = await puppeteer.launch();
  const page = await browser.newPage();
  await page.setContent(finalHtml);
  await page.pdf({ path: "report.pdf", format: "A4" });
  await browser.close();

  console.log("\nReport generated successfully: report.pdf");
}

main().catch(console.error);
运行您的应用
您现在可以运行应用了。在终端中执行以下命令:
npm
npx tsc && node main.jspnpm
pnpm tsx main.ts纱线
yarn tsc && node main.js当脚本执行每个步骤时,您会在终端中看到日志记录。
完成后,系统会在项目目录中创建一个包含市场分析的 report.pdf 文件。
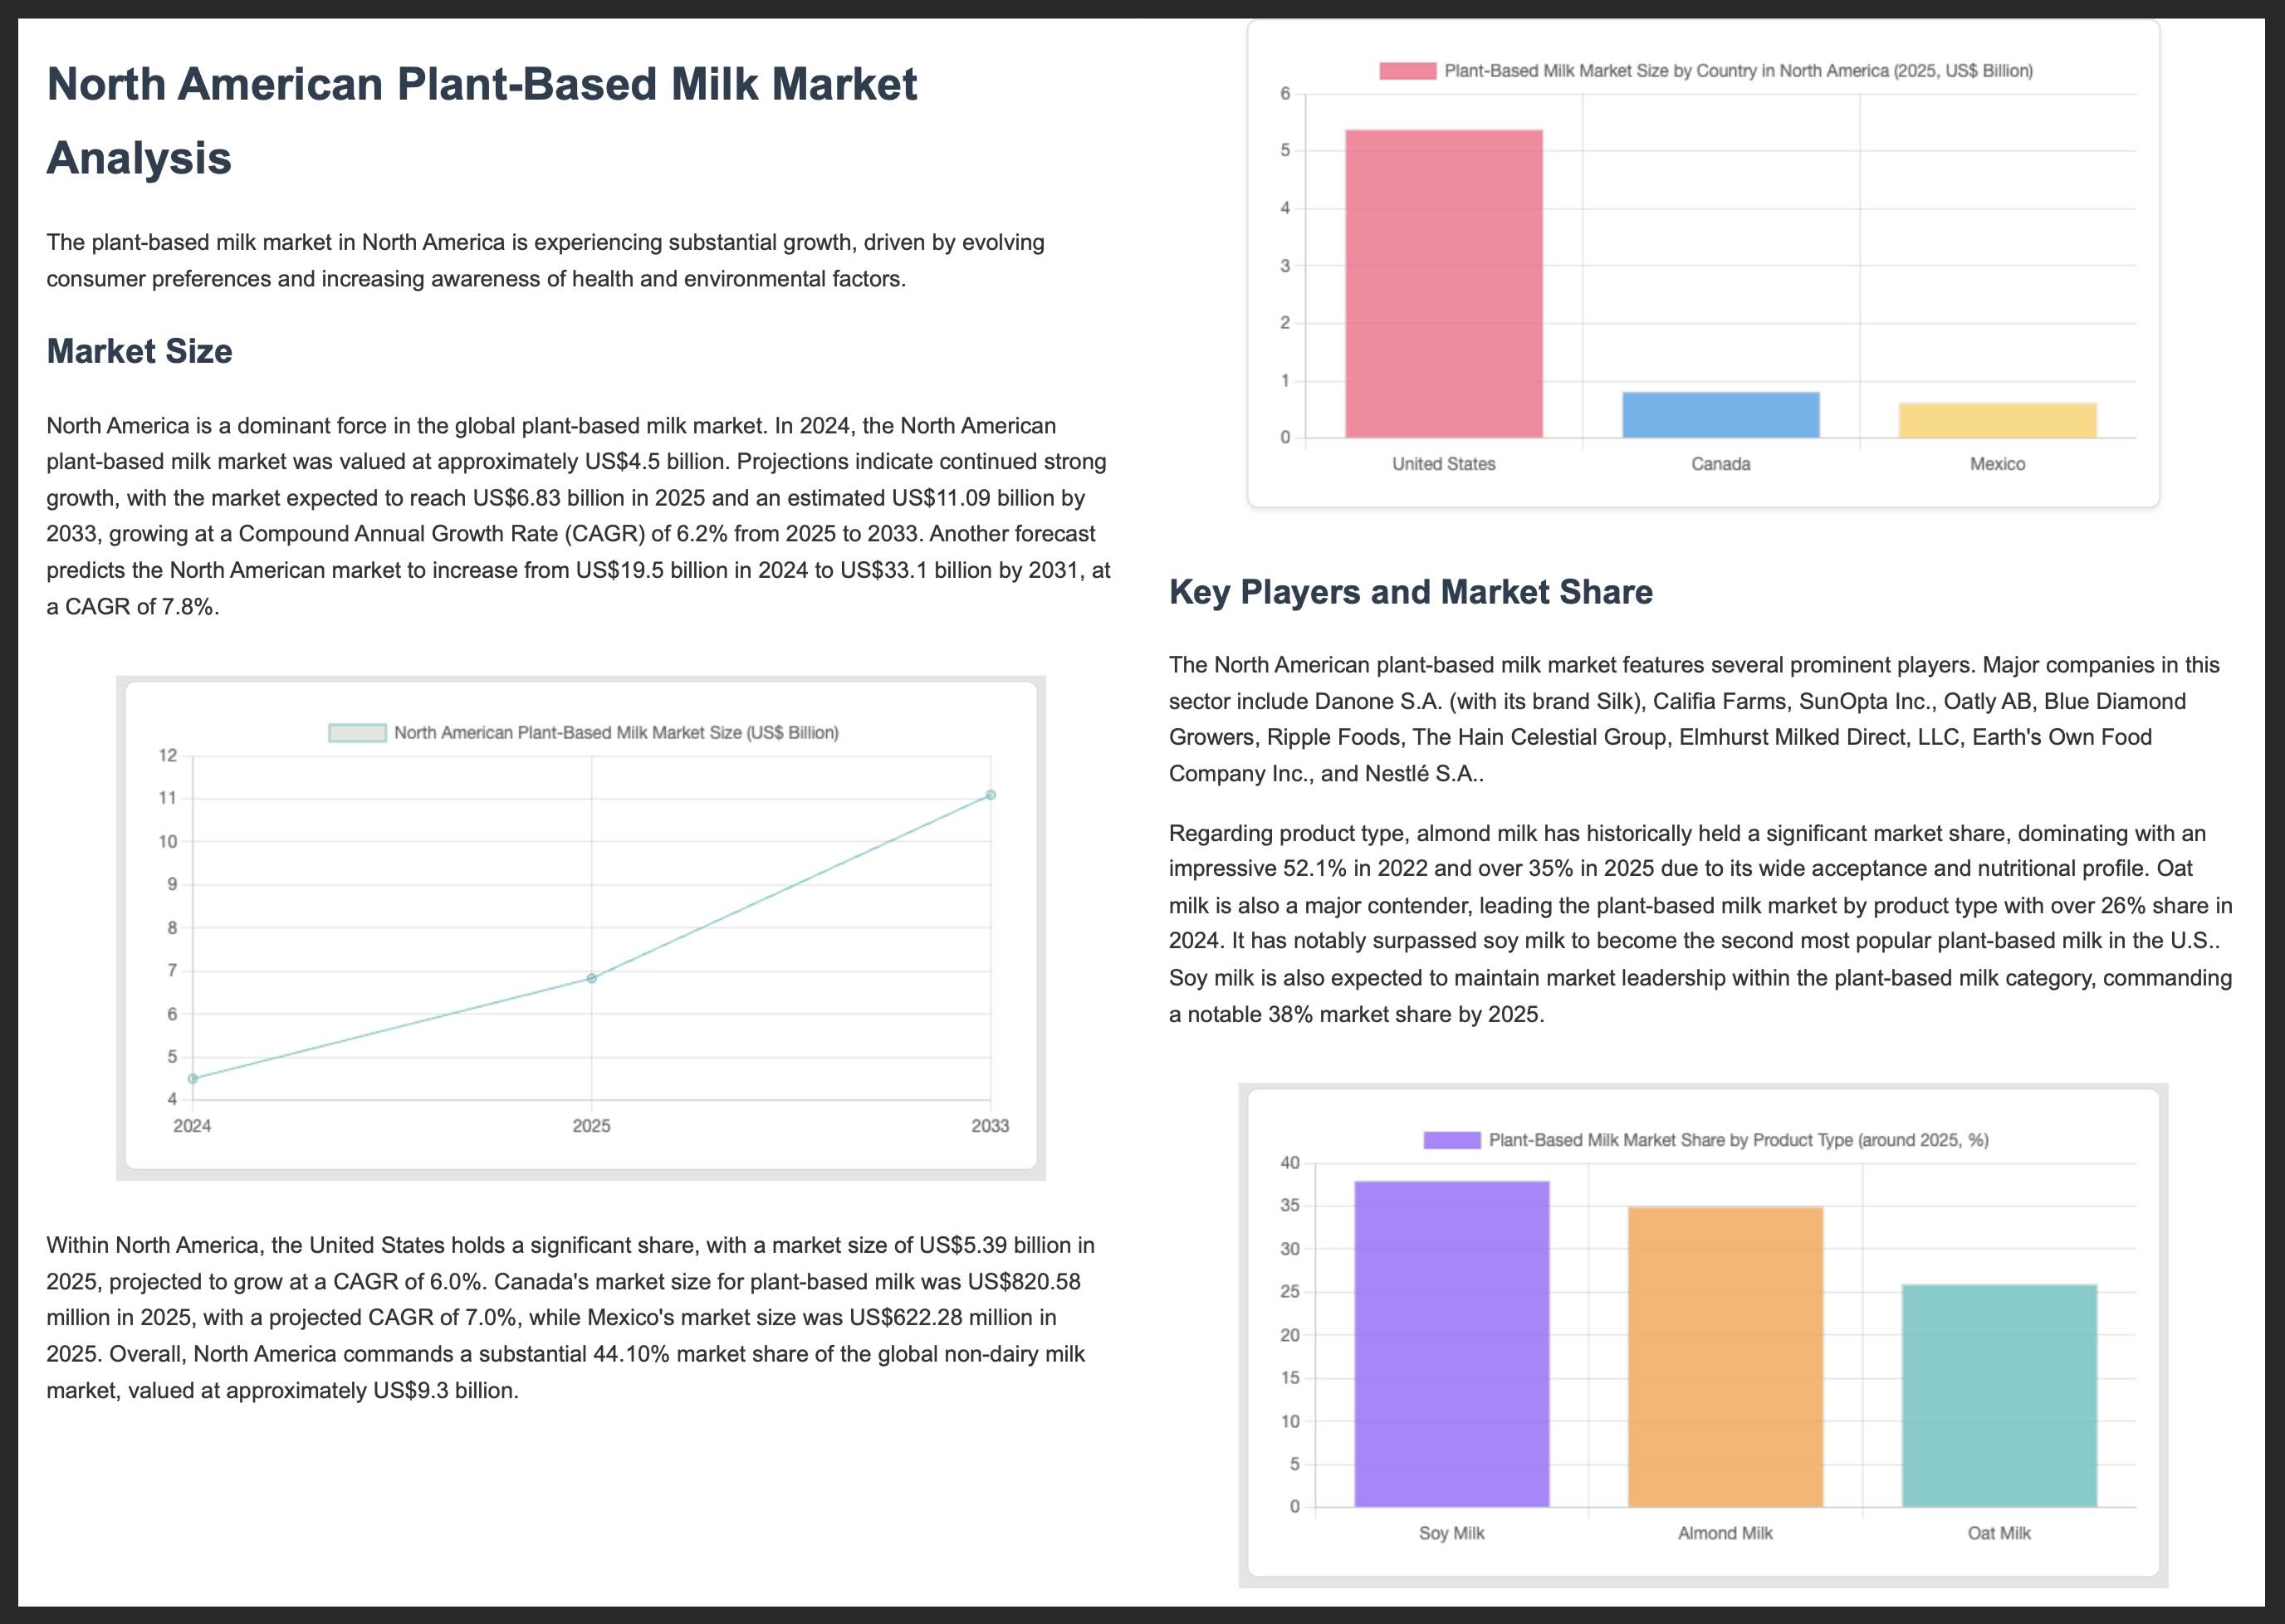
下面显示的是 PDF 报告示例的前两页:
更多资源
如需详细了解如何使用 Gemini 和 AI SDK 进行构建,请探索以下资源: