Vercel 的 AI SDK 是功能強大的開放原始碼程式庫,可使用 TypeScript 建構 AI 輔助應用程式、使用者介面和代理程式。
本指南會逐步說明如何使用 TypeScript 建構 Node.js 應用程式,透過 Google 生成式 AI Provider 使用 AI SDK 連線至 Gemini API,並自動分析市場趨勢。最終應用程式將:
- 使用 Gemini 和 Google 搜尋研究當前的市場趨勢。
- 從研究資料中擷取結構化資料,然後生成圖表。
- 將研究和圖表合併為專業的 HTML 報表,並儲存為 PDF。
必要條件
如要完成本指南,您需要:
- Gemini API 金鑰。您可以在 Google AI Studio 免費建立。
- Node.js 18 以上版本。
- 套件管理工具,例如
npm、pnpm或yarn。
設定應用程式
首先,請為專案建立新目錄並初始化。
npm
mkdir market-trend-appcd market-trend-appnpm init -y
pnpm
mkdir market-trend-appcd market-trend-apppnpm init
紗線
mkdir market-trend-appcd market-trend-appyarn init -y
安裝依附元件
接著,請安裝 AI SDK、Google 生成式 AI 提供者和其他必要依附元件。
npm
npm install ai @ai-sdk/google zodnpm install -D @types/node tsx typescript && npx tsc --init
如要避免發生 TypeScript 編譯器錯誤,請在產生的 tsconfig.json 中註解排除下列程式碼:
//"verbatimModuleSyntax": true,
pnpm
pnpm add ai @ai-sdk/google zodpnpm add -D @types/node tsx typescript
紗線
yarn add ai @ai-sdk/google zodyarn add -D @types/node tsx typescript && yarn tsc --init
如要避免發生 TypeScript 編譯器錯誤,請在產生的 tsconfig.json 中註解排除下列程式碼:
//"verbatimModuleSyntax": true,
這個應用程式也會使用第三方套件 Puppeteer 和 Chart.js 算繪圖表及建立 PDF:
npm
npm install puppeteer chart.jsnpm install -D @types/chart.js
pnpm
pnpm add puppeteer chart.jspnpm add -D @types/chart.js
紗線
yarn add puppeteer chart.jsyarn add -D @types/chart.js
puppeteer 套件需要執行指令碼才能下載 Chromium 瀏覽器。套件管理員可能會要求核准,因此系統提示時,請務必核准指令碼。
設定 API 金鑰
使用 Gemini API 金鑰設定 GOOGLE_GENERATIVE_AI_API_KEY 環境變數。Google 生成式 AI Provider 會自動在這個環境變數中尋找 API 金鑰。
macOS/Linux
export GOOGLE_GENERATIVE_AI_API_KEY="YOUR_API_KEY_HERE"Powershell
setx GOOGLE_GENERATIVE_AI_API_KEY "YOUR_API_KEY_HERE"建立應用程式
現在,讓我們為應用程式建立主要檔案。在專案目錄中建立名為 main.ts 的新檔案。您將逐步建構這個檔案中的邏輯。
如要快速測試,確保所有設定皆正確無誤,請將下列程式碼新增至 main.ts。這個基本範例會使用 generateText,從 Gemini 取得簡單的回覆。
import { google } from "@ai-sdk/google";
import { generateText } from "ai";

async function main() {
  const { text } = await generateText({
    model: google("gemini-3.5-flash"),
    prompt: 'What is plant-based milk?',
  });

  console.log(text);
}

main().catch(console.error);
在增加複雜度之前,請先執行這項指令碼,確認環境設定正確無誤。在終端機中執行下列指令:
npm
npx tsc && node main.jspnpm
pnpm tsx main.ts紗線
yarn tsc && node main.js如果一切設定正確,您會在控制台中看到 Gemini 的回覆。
使用 Google 搜尋進行市場調查
如要取得最新資訊,可以為 Gemini 啟用 Google 搜尋工具。啟用這項工具後,模型就能搜尋網路來回覆提示,並提供使用的來源。
將 main.ts 的內容替換為下列程式碼,執行分析的第一個步驟。
import { google } from "@ai-sdk/google";
import { generateText } from "ai";

async function main() {
  // Step 1: Search market trends
  const { text: marketTrends, sources } = await generateText({
    model: google("gemini-3.5-flash"),
    tools: {
      google_search: google.tools.googleSearch({}),
    },
    prompt: `Search the web for market trends for plant-based milk in North America for 2024-2025.
          I need to know the market size, key players and their market share, and primary consumer drivers.
          `,
  });

  console.log("Market trends found:\n", marketTrends);
  // To see the sources, uncomment the following line:
  // console.log("Sources:\n", sources);
}

main().catch(console.error);
擷取圖表資料
接著,我們來處理研究文字,擷取適合用於圖表的結構化資料。使用 AI SDK 的 generateObject 函式和 zod
結構定義確切的資料結構。
此外,請建立輔助函式,將這項結構化資料轉換為 Chart.js 可解讀的設定。
在 main.ts 中加入下列程式碼。請注意新增的匯入項目和「步驟 2」。
import { google } from "@ai-sdk/google";
import { generateText, generateObject } from "ai";
import { z } from "zod/v4";
import { ChartConfiguration } from "chart.js";

// Helper function to create Chart.js configurations
function createChartConfig({labels, data, label, type, colors,}: {
  labels: string[];
  data: number[];
  label: string;
  type: "bar" | "line";
  colors: string[];
}): ChartConfiguration {
  return {
    type: type,
    data: {
      labels: labels,
      datasets: [
        {
          label: label,
          data: data,
          borderWidth: 1,
          ...(type === "bar" && { backgroundColor: colors }),
          ...(type === "line" && colors.length > 0 && { borderColor: colors[0] }),
        },
      ],
    },
    options: {
      animation: { duration: 0 }, // Disable animations for static PDF rendering
    },
  };
}

async function main() {
  // Step 1: Search market trends
  const { text: marketTrends, sources } = await generateText({
    model: google("gemini-3.5-flash"),
    tools: {
      google_search: google.tools.googleSearch({}),
    },
    prompt: `Search the web for market trends for plant-based milk in North America for 2024-2025.
          I need to know the market size, key players and their market share, and primary consumer drivers.
          `,
  });

  console.log("Market trends found.");

  // Step 2: Extract chart data
  const { object: chartData } = await generateObject({
    model: google("gemini-3.5-flash"),
    schema: z.object({
      chartConfigurations: z
        .array(
          z.object({
            type: z.enum(["bar", "line"]).describe('The type of chart to generate. Either "bar" or "line"',),
            labels: z.array(z.string()).describe("A list of chart labels"),
            data: z.array(z.number()).describe("A list of the chart data"),
            label: z.string().describe("A label for the chart"),
            colors: z.array(z.string()).describe('A list of colors to use for the chart, e.g. "rgba(255, 99, 132, 0.8)"',),
          }),
        )
        .describe("A list of chart configurations"),
    }),
    prompt: `Given the following market trends text, come up with a list of 1-3 meaningful bar or line charts
    and generate chart data.

Market Trends:
${marketTrends}
`,
  });

  const chartConfigs = chartData.chartConfigurations.map(createChartConfig);

  console.log("Chart configurations generated.");
}

main().catch(console.error);
生成最終報告
最後一個步驟是請 Gemini 扮演專業報告撰寫者的角色。提供市場研究、圖表設定,以及建構 HTML 報表的明確指令集。接著,使用 Puppeteer 算繪這個 HTML,並儲存為 PDF。
將最終的 puppeteer 匯入項目和「步驟 3」新增至 main.ts 檔案。
// ... (imports from previous step)
import puppeteer from "puppeteer";

// ... (createChartConfig helper function from previous step)

async function main() {
  // ... (Step 1 and 2 from previous step)

  // Step 3: Generate the final HTML report and save it as a PDF
  const { text: htmlReport } = await generateText({
    model: google("gemini-3.5-flash"),
    prompt: `You are an expert financial analyst and report writer.
    Your task is to generate a comprehensive market analysis report in HTML format.

    **Instructions:**
    1.  Write a full HTML document.
    2.  Use the provided "Market Trends" text to write the main body of the report. Structure it with clear headings and paragraphs.
    3.  Incorporate the provided "Chart Configurations" to visualize the data. For each chart, you MUST create a unique <canvas> element and a corresponding <script> block to render it using Chart.js.
    4.  Reference the "Sources" at the end of the report.
    5.  Do not include any placeholder data; use only the information provided.
    6.  Return only the raw HTML code.

    **Chart Rendering Snippet:**
    Include this script in the head of the HTML: <script src="https://cdn.jsdelivr.net/npm/chart.js"></script>
    For each chart, use a structure like below, ensuring the canvas 'id' is unique for each chart, and apply the correspinding config:

    ---
    <div style="width: 800px; height: 600px;">
      <canvas id="chart1"></canvas>
    </div>
    <script>
      new Chart(document.getElementById('chart1'), config);
    </script>
    ---
    (For the second chart, use 'chart2' and the corresponding config, and so on.)

    **Data:**
    - Market Trends: ${marketTrends}
    - Chart Configurations: ${JSON.stringify(chartConfigs)}
    - Sources: ${JSON.stringify(sources)}
    `,
  });

  // LLMs may wrap the HTML in a markdown code block, so strip it.
  const finalHtml = htmlReport.replace(/^```html\n/, "").replace(/\n```$/, "");

  const browser = await puppeteer.launch();
  const page = await browser.newPage();
  await page.setContent(finalHtml);
  await page.pdf({ path: "report.pdf", format: "A4" });
  await browser.close();

  console.log("\nReport generated successfully: report.pdf");
}

main().catch(console.error);
執行應用程式
現在可以執行應用程式了。在終端機中執行下列指令:
npm
npx tsc && node main.jspnpm
pnpm tsx main.ts紗線
yarn tsc && node main.js指令碼執行每個步驟時,終端機中會顯示記錄。
完成後,專案目錄中會建立包含市場分析的 report.pdf 檔案。
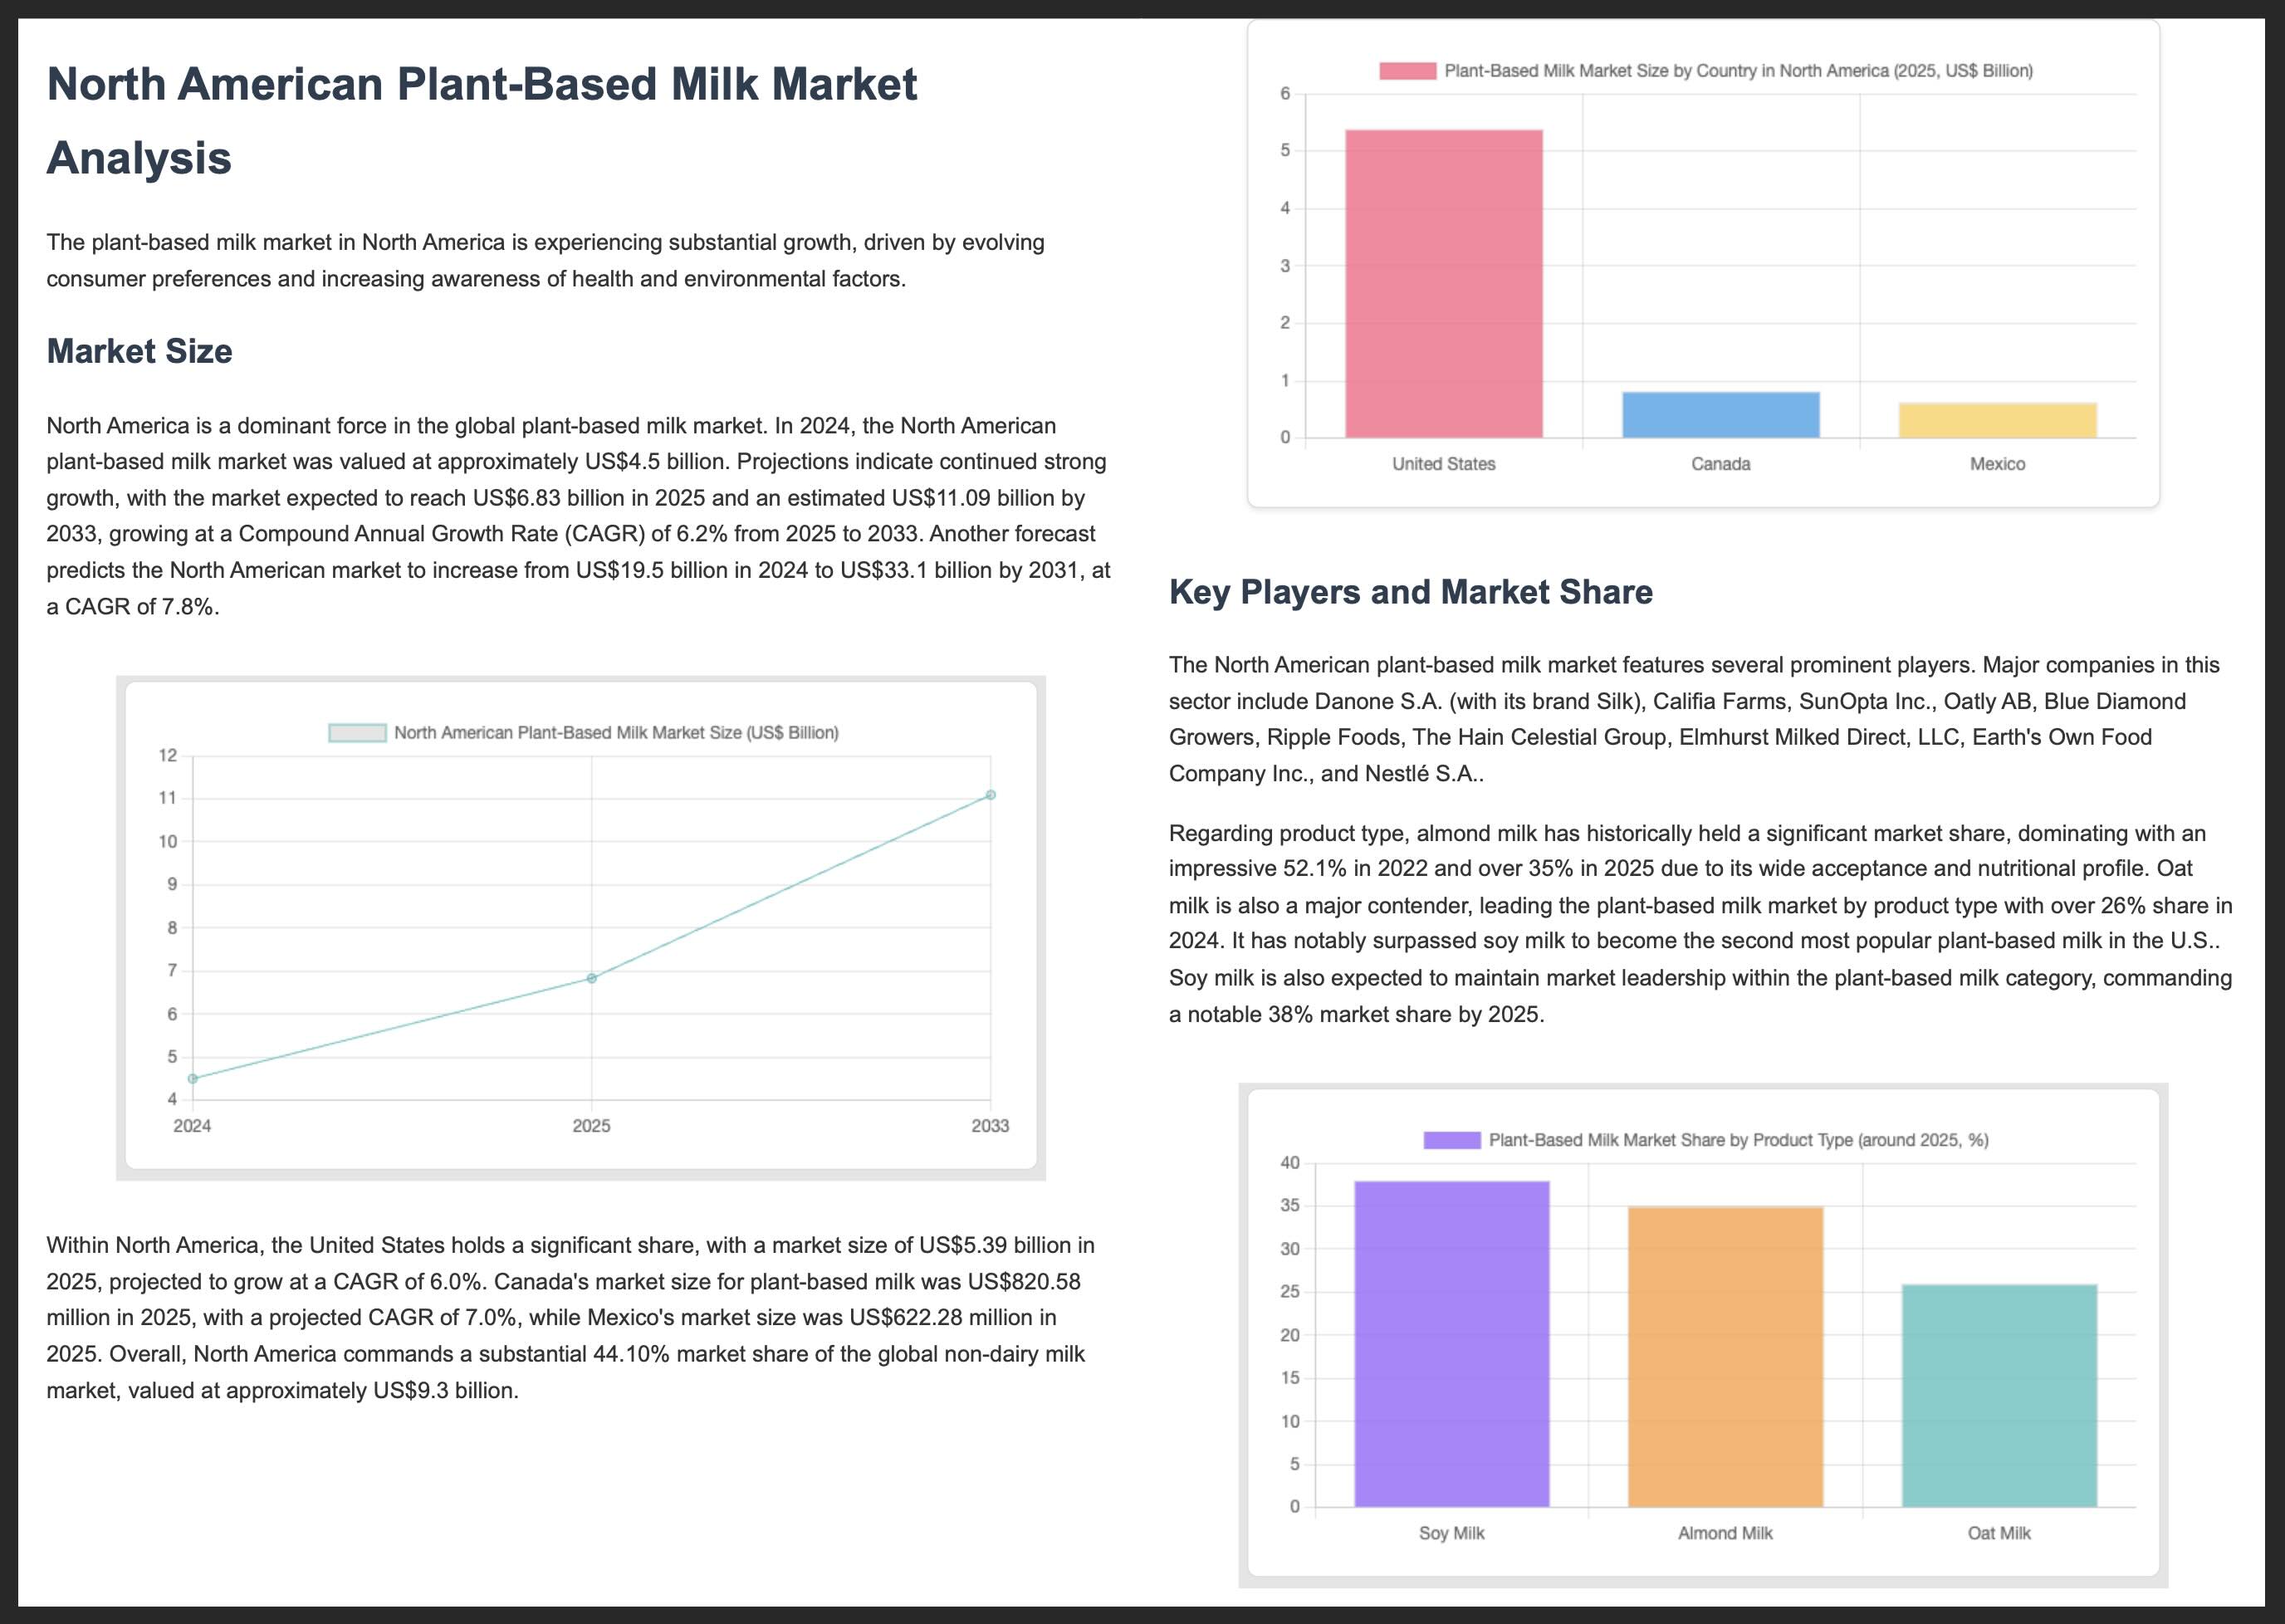
以下是範例 PDF 報表的前兩頁:
其他資源
如要進一步瞭解如何使用 Gemini 和 AI SDK 建構內容,請參閱下列資源: